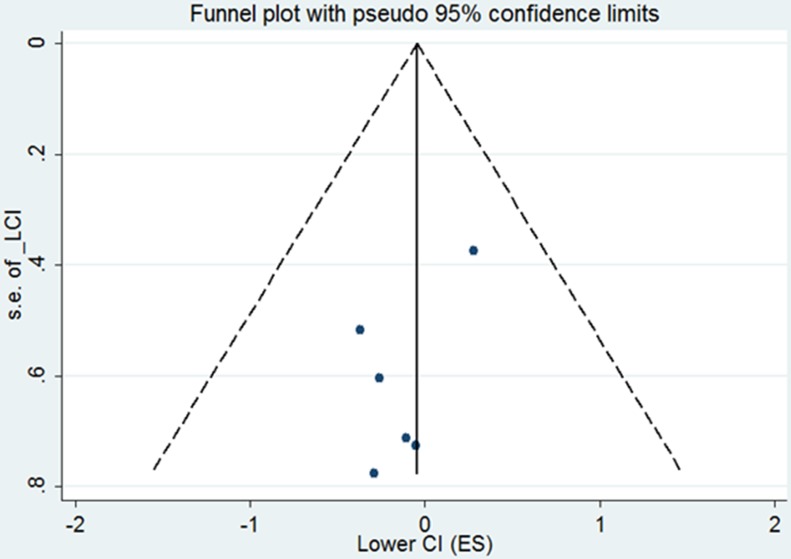
Figure 7. Funnel plot of the relationship between the hazard ratio and standard error of the log HR for overall survival in three different subtypes.
The dotted line indicates the combined HR for all studies of overall survival. Filled circles represent the 6 subgroups to account for potential publication bias.

