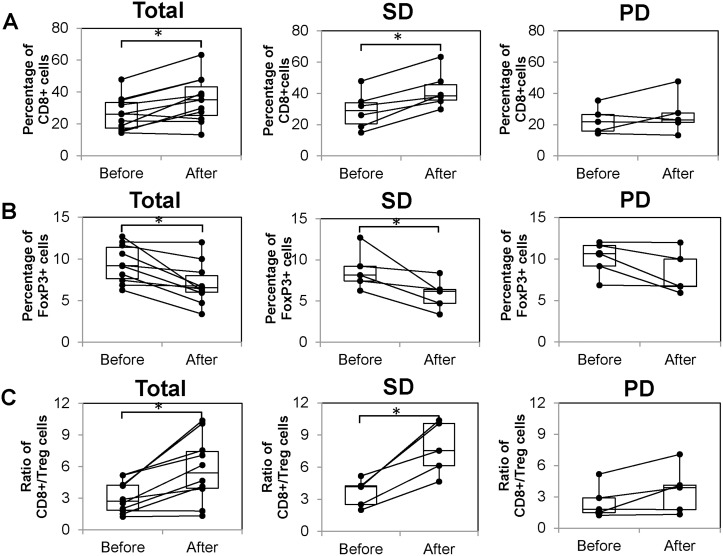
Figure 2. Immunological responses before and after administration.
The left graphs show results of all patients that were measurable before and after administration. The middle graphs show the results of only SD patients and the right graphs show those of PD patients only. (A) Number of CD8+ T cells before and after 6th administration. (B) Number of FoxP3+ T cells before and after 6th administration. (C) Ratio of CD8+/Treg cells before and after 6th administration.

