
Figure 4.
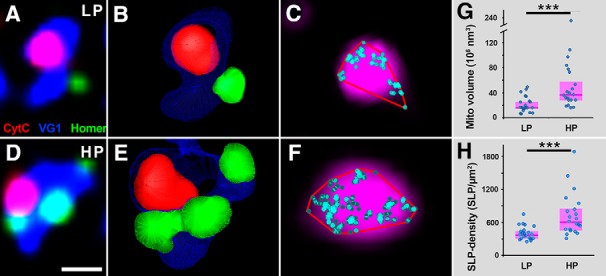
CytC content of presynaptic mitochondria scales with synaptic performance at glutamatergic synapses. A, Confocal image shows a glutamatergic bouton (VG1, blue), containing a mitochondrion (Cyt-C, red), and its synapse (Homer1a, green). B, The 3D model of the bouton from A was reconstructed from the confocal stack. C, Confocal and STORM image of mitochondrion enlarged from the same bouton (Cyt-C confocal in magenta, Cyt-C localization points in cyan, 2D convex hull in red). D–F, Another bouton depicted as in A–C. Mitochondria-containing synaptic boutons were divided into LP and HP groups, based on the corresponding Homer volumes. Bouton in A–C represents a LP, bouton in D–F represents a HP bouton. G, Mitochondria in the HP boutons are larger than those in the LP boutons, as the CytC-volumes are significantly larger in the former group (Mann–Whitney U test, p = 0.00032, n = 42 mitochondria from two mice). H, Mitochondria in the HP boutons contain CytC in a higher density than those in the LP boutons (Mann–Whitney U test, p = 0.00016, n = 42 mitochondria from two mice). Blue dots represent values from individual mitochondria, magenta rectangles represent interquartile ranges, deep-magenta lines mark median values. Scale bars: 800 nm (A, D), 200 nm (C, F). The 3D models on B, E are not displayed on the same scale. See also Extended Data Figure 3-1.