
Extended Data Figure 6. Temporal similarity among two-hit genes.
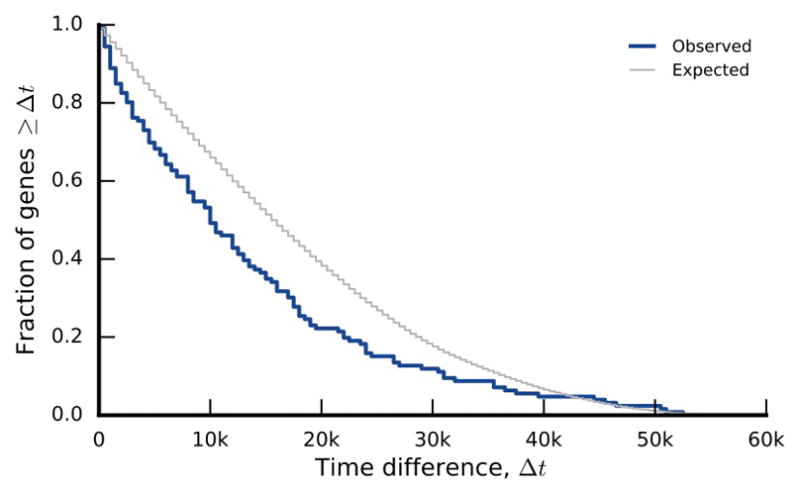
The distribution of the difference between the earliest and latest appearance times in genes with exactly two detected mutations in the nonmutator lines. The null distribution is obtained by randomly permuting appearance times among the 2-hit genes.