
Figure 3. Frequencies of mutant alleles associated with colistin resistance in P. aeruginosa PAO1.
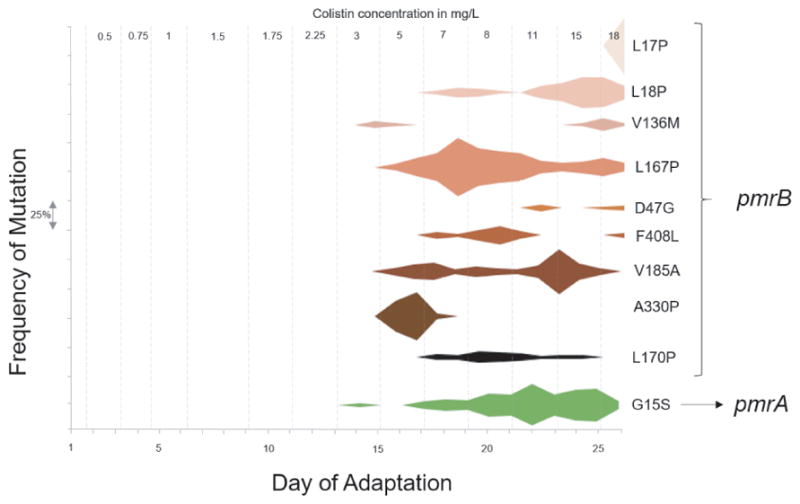
Mutations in the pmrAB operon were identified by analysis of whole genome sequencing data obtained from each daily population collected from the bioreactor. The frequency of each mutation is on Y-axis and each interval on the axis represents a frequency of 25%. The corresponding day on which the mutation is observed is on the X-axis. The grey dashed lines represent the distinct colistin concentrations the culture was exposed to during evolution. The mutations on the right are the amino acid changes in the protein caused by single nucleotide polymorphisms (SNPs) in the corresponding gene (pmrA or pmrB). Note that some mutations such as pmrB A330P have early success but then become extinct as other more successful pmrA alleles confer greater success to drug selection.