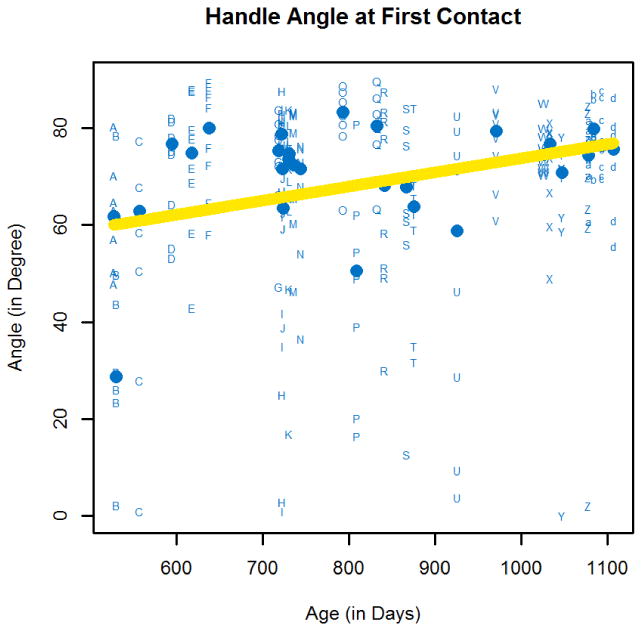
Figure 4.

The data represent the angle between the handle of the object and the table surface. The individual trials for each child are shown using letters. Each letter refers to the data from a given child. Upper case letters are assigned in order of age at testing and switch to lower case after the 26th youngest child. “A” thus refers the youngest and “a” to the 27th youngest child. The average angle across all trials for each child is also shown (•), as is the estimated average as a function of age, when controlling for grip, from the GEE model (yellow line).
