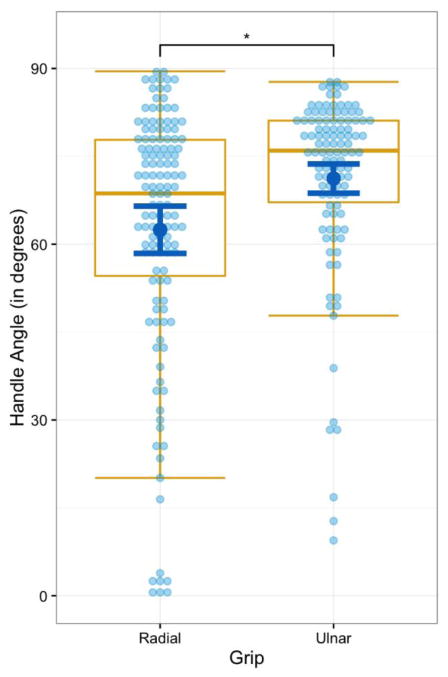
Figure 5.

The data represent the angle between the handle of the object and the table surface. The group average (•) and the standard error of the mean (blue error bars) from the GEE model are shown for the radial and ulnar grip. The data are also shown as a box-and-whiskers plot (gold lines), representing the quartiles of the data and as a dot plot (light-blue dots), further illustrating the distribution of the data within each grip condition.
