
Figure 8.
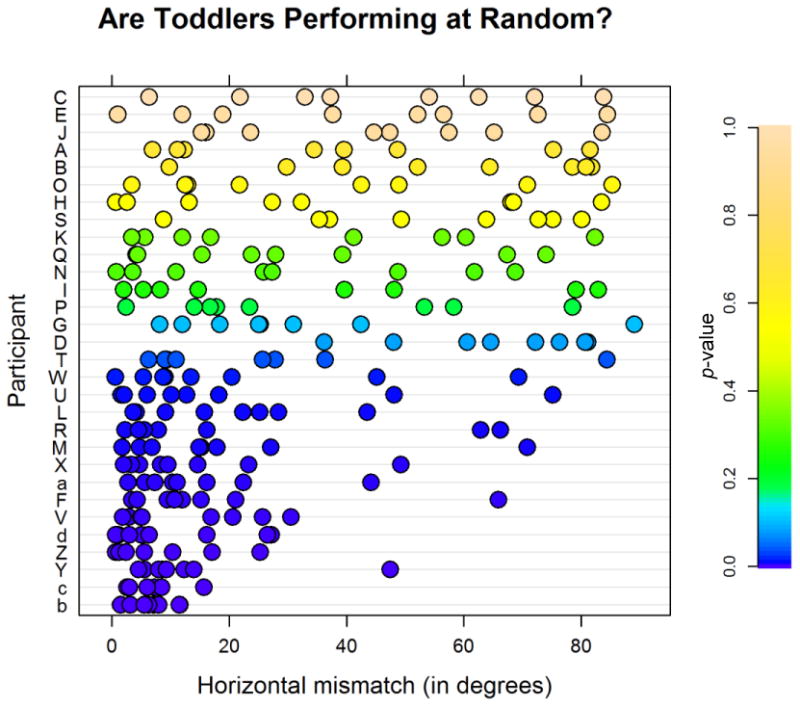
Shows all eight trials from each of the children; each child's data are graphed on a horizontal line. Children are ordered on the y-axis according to the p-values from the Kolmogorov-Smirnov test, starting with the highest (and thus most likely to have stemmed from a uniform distribution) to the lowest. Data are also color coded according to the p-values (see color scale). Participants are labeled as before using letters in order of age and repeating in lower case after the 26th child. See the online article for the color version of this figure.