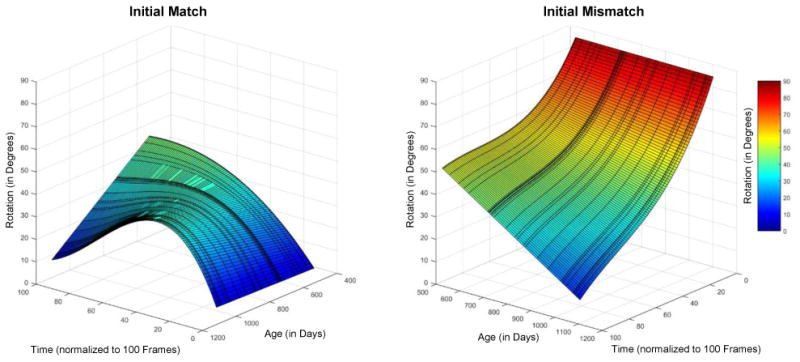
Figure 9.

Depicted is the estimated angle between the rod and the slot in the horizontal plane throughout the entire transport phase (time data are normalized to 100 frames) for all children. Because matching trials start with a 0° angle and mismatch trials with 90° these were plotted separately in (a) and (b) respectively. Note that the due to the difference in starting positions the viewing angle for the two conditions are rotated by one turn, the result is that age and time are on different axes in the two graphs. See the online article for the color version of this figure.
