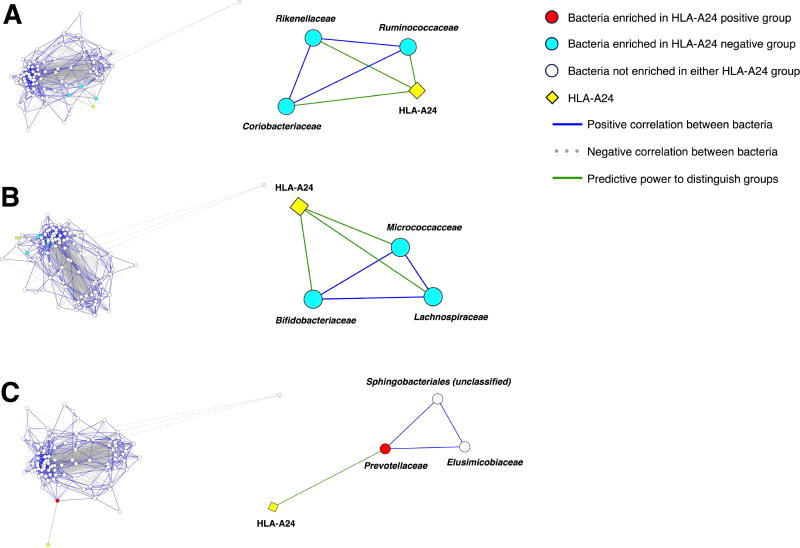
Figure 5.
Co-occurrence network analysis at the family level. Left side of the figure demonstrates the entire network of relationships among taxa. Right side of the figure demonstrates specific cliques of taxa, which co-occur with one another and with at least one taxon in each clique having predictive power for HLA-A24 allele status. In the overall network and cliques, edge lengths are inversely proportional to the strength of the correlation or the strength of predictive power that distinguishes between HLA-A24 positive and negative groups. Taxa that were enriched in the HLA-A24 negative cohort; each individual taxon also had predictive power for HLA-A24 status (A and B). Only Prevotellaceae was enriched in the HLA-A24 positive cohort and had predictive power for HLA-A24 status (C).

