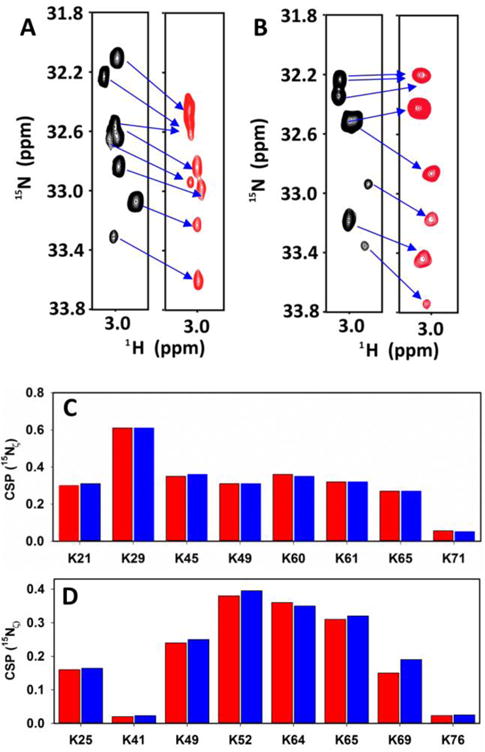
Fig. 5.

H2CN spectra of CXCL1 (A) and CXCL5 (B) in the free (black) and heparin dp8-bound (red) forms. The spectra were acquired in 50 mM sodium phosphate pH 5.7 at 40 °C. Summary of heparin binding-induced chemical shift changes of15Nζ from the lysine NH3+ group in CXCL1 (C) and CXCL5 (D). Data for dp8 and dp14 are shown in red and blue, respectively.
