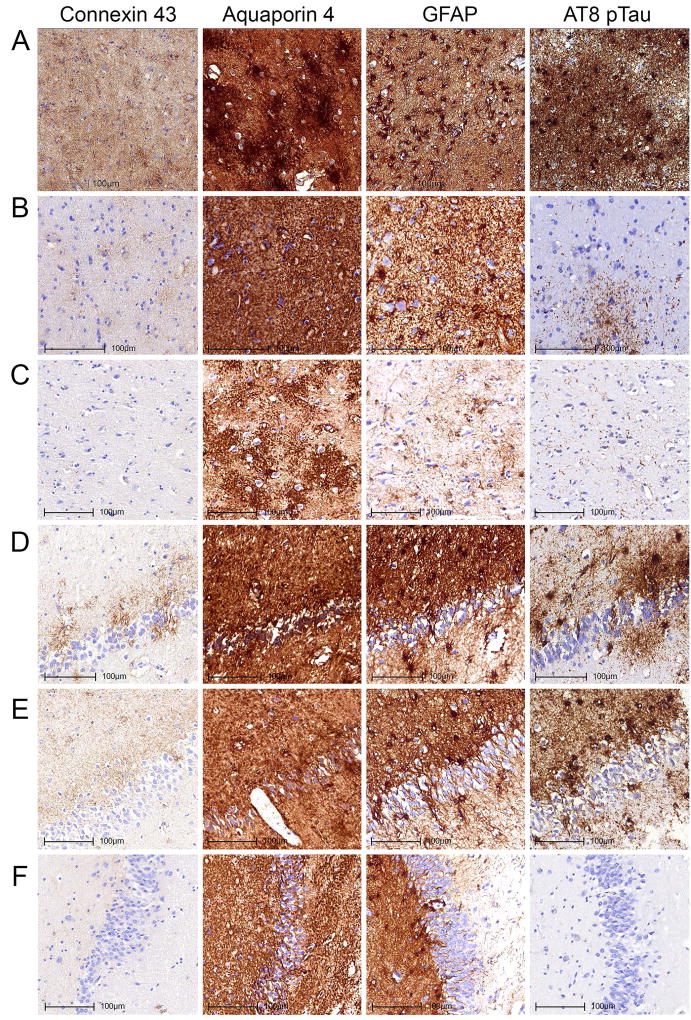
Fig 3.
Immunostaining patterns of Cx43, AQP4, GFAP and AT8 pTau in the amygdala (A–C) and dentate gyrus of the hippocampus (D–F) representing different degrees of burden of tau pathologies. Images A and D represent case ARTAG-2 demonstrating prominent grey matter ARTAG, B represents case ARTAG-16 and E represents case ARTAG-1 demonstrating moderate degree of grey matter ARTAG; C and F represents case CO-5 lacking grey matter ARTAG.

