
Figure 1.
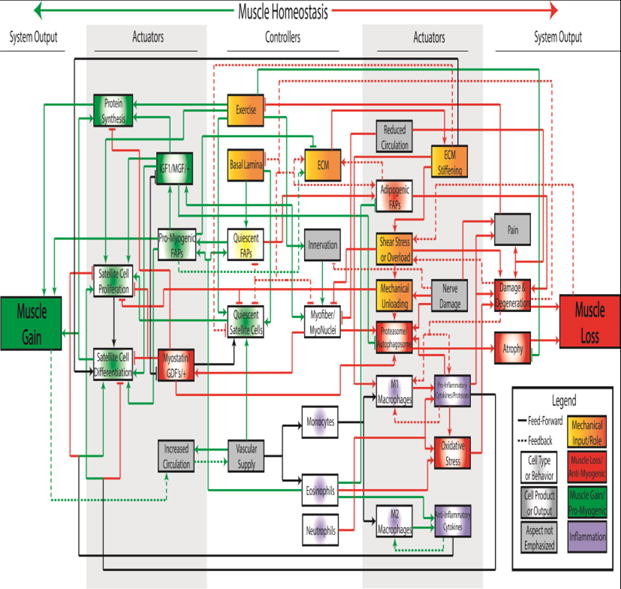
Conceptual control system diagram representing 33 key controllers and actuators of muscle gain (green) and loss (red) that may be affected in rotator cuff muscle pathology. Black lines represent processes that may contribute to muscle gain or loss, depending on context. Lines ending in arrowheads indicate a proliferative, intensifying or otherwise increasing effect on the indicated element, while lines ending in perpendicular lines indicate an inhibitory or otherwise diminishing effect. Dashed lines denote downstream processes that feed backward through the system to modulate upstream cell populations or processes. Additionally, system elements are color-coded by predominant functional category and shaded to indicate biological category, though again some elements may contribute to gain or loss in a context dependent manner. It is important to note that this is not a comprehensive map and does not show all known or possible interactions.