
Figure 1. EtOH enhances GABAergic transmission in the NTS.
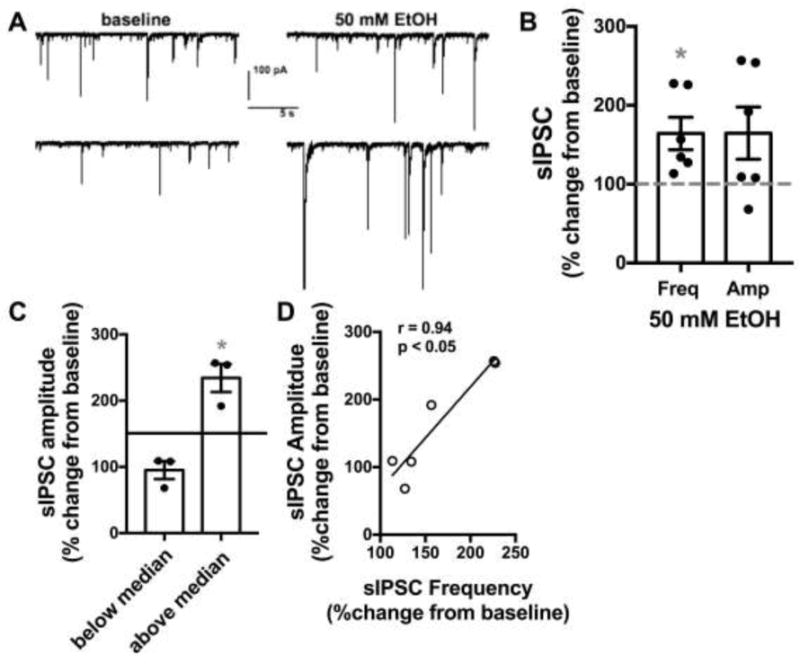
A) Exemplar traces from one neuron tested showing the effects of 50 mM EtOH on sIPSCs compared to baseline. Top and bottom traces are continuous but separated into two lines due to space constraints. B) Bar graph summarizing the effects of EtOH on sIPSC frequency and amplitude normalized as percent change from baseline. Black circles are individual data points. Dashed line indicates baseline level, normalized to 100%. Asterisk indicates significant difference from baseline. C) Bar graph summarizing the median split of sIPSC amplitude data from B. Data is expressed as change from normalized baseline (100%). Black circles are individual data point. Solid line indicates median. Asterisk indicates a significant difference from baseline. D) Correlation examining the magnitude of EtOH induced changes to sIPSC frequency vs amplitude, expressed as percent changes from normalized baselines.