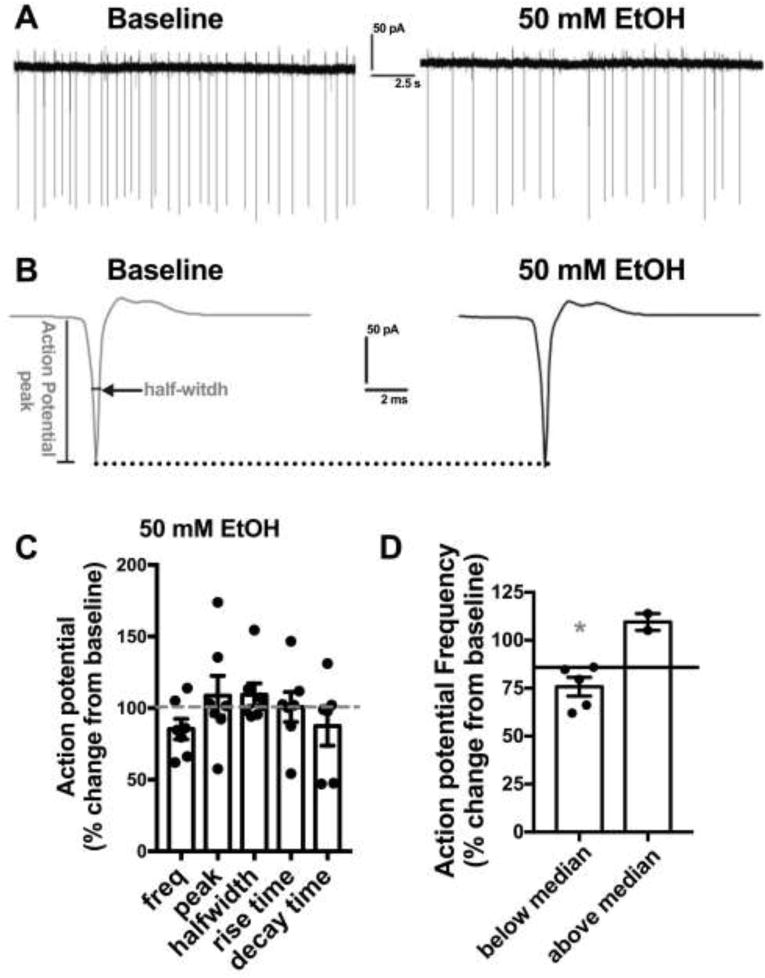
Figure 3. EtOH predominantly inhibits action potential firing in the NTS.

A) Exemplar traces showing the effects of 50 mM EtOH on action potential firing compared to baseline. B) Exemplar traces showing averaged action potential waveform from experiment in A. Determination of action potential peak and half-width are shown. Dotted line shows no change in peak between baseline and EtOH C) Bar graph summarizing the effects of EtOH on action potential frequency and kinetics normalized as percent change from baseline. Black circles are individual data points. Dashed line indicates baseline level, normalized to 100%. D) Bar graph summarizing the median split of action potentiation frequency data from B. Data is expressed as change from normalized baseline (100%). Black circles are individual data points. Solid line indicates group median. Asterisk indicates a significant difference from baseline.
