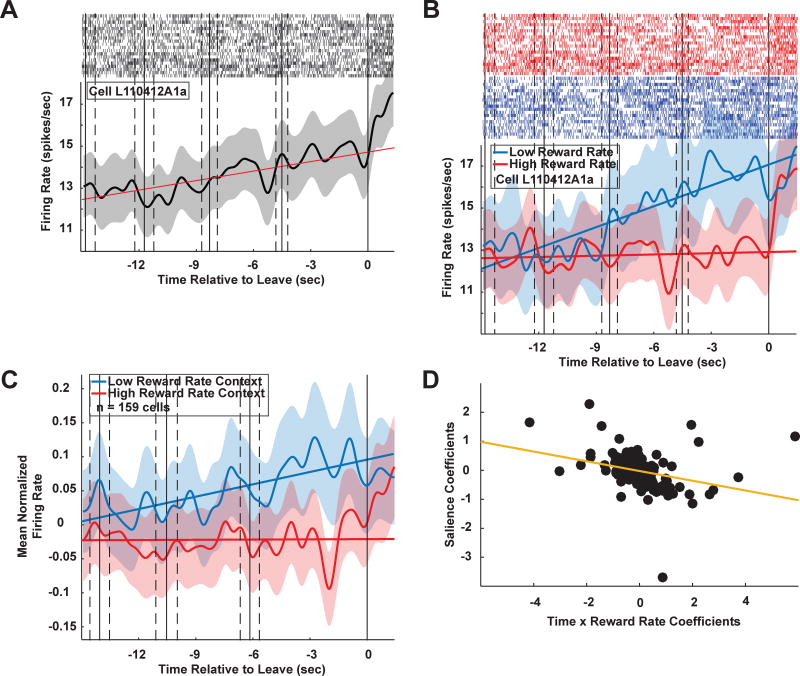
Figure 2.
PCC neurons predict patch departures several seconds in advance. A. Sample cell PSTH starting 15 seconds before patch departure. This cell shows a marked increase in firing (thick black line) during the 15 second patch exit window. Red line: linear fit to firing rate within the patch exit window. Gray shading: ± 1 s.e.m. Light gray tickmarks: Sample raster plots from 20 patches. B. Same cell as in (A), showing differences in firing dynamics depending on environmental richness preceding decisions to leave a patch. Rich contexts (red trace): reward rate z-score ≥ 0; poor contexts (blue trace): reward rate z-score < 0. C. Population plot for rich and poor environments, matching the pattern observed in the sample cell in (B). n = 159 cells (96 from ML, 63 from MR). D. Salience coefficients plotted against the interaction of time and reward rate coefficients. Later and lower reward rates resulted in stronger salience signaling. See also Figure S3. See Figure S1 for individual monkey results.

