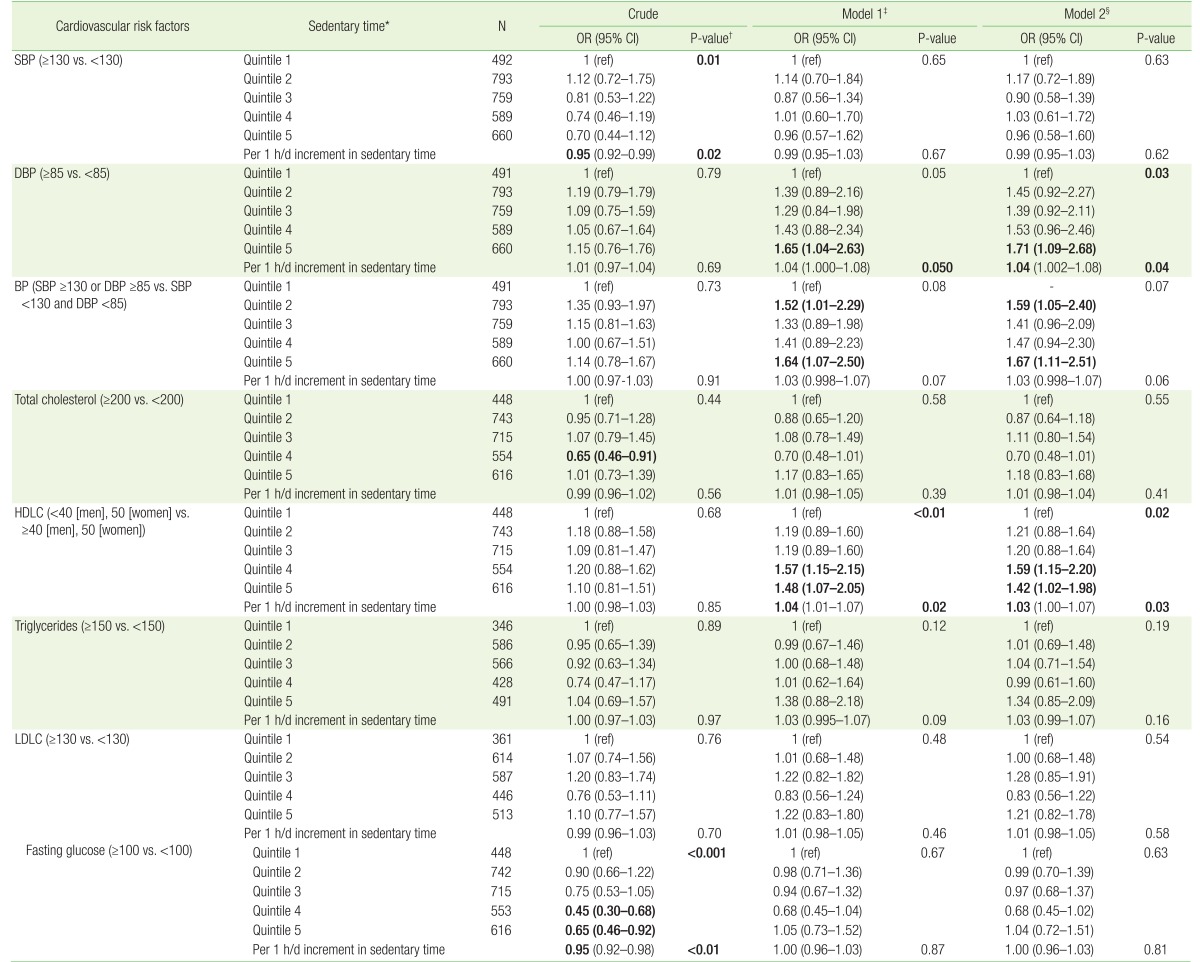
Table 3. ORs and 95% CIs of cardiovascular risk factors according to sedentary time.
All values are presented after survey analysis. Statistically significant results are marked in bold.
OR, odds ratio; CI, confidence interval; SBP, systolic blood pressure; ref, reference; DBP, diastolic blood pressure; BP, blood pressure; HDLC, high-density lipoprotein cholesterol; LDLC, low-density lipoprotein cholesterol.
*Quintile cutoff points were 3.0, 4.5, 6.0, and 9.5 h/d (quintile 1 [<3.0], quintile 2 [3.0–4.5], quintile 3 [4.5–6.0], quintile 4 [6.0–9.5], and quintile 5 [≥9.5]). †The first P-values are Ptrend, and the second P-values are statistical significance of ORs. ‡Adjusted for age, sex, education level (below high school/high school/above high school), income level (quartile), marital status (couple/single/others), type of occupation (inactive/active), residence (urban/rural), menopausal status (premenopause/menopause), smoking status (non-smoker/ex-smoker/current smoker), alcohol intake (non/moderate/heavy), and calorie intake (tertile). §Based on model 1, model 2 was further adjusted for body mass index (low to normal/overweight/obese), waist circumference (normal/abdominal obesity), and moderate-to-vigorous physical activity (tertile).

