Fig. 5.
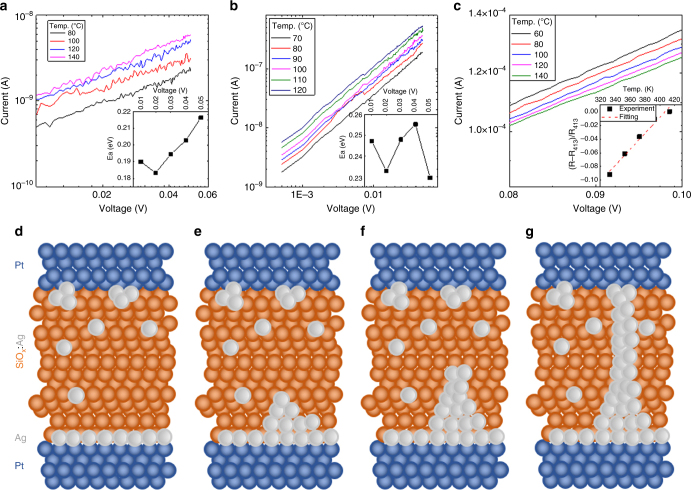
Mechanism study for the change of the threshold properties. Log I–Log V curves measured at different temperatures of the partially electroformed state obtained by applying (a) 2 V (80 ~ 140 °C), (b) 3 V (70 ~ 120 °C) pre-pulses and (inset to a and b). Extracted activation energy for hopping conduction between 0.01 V and 0.05 V ranges. (c) Temperature dependent I–V curves for fully electroformed state obtained by applying 4.5 V pre-pulse and (inset to c) (R–R413K)/R413K vs. temperature plot. Schematic diagrams illustrating the distribution of Ag ions in (d) the normal off state, (e and f) partially electroformed state (2, 3 V), and (g) fully electroformed state (4.5 V)

