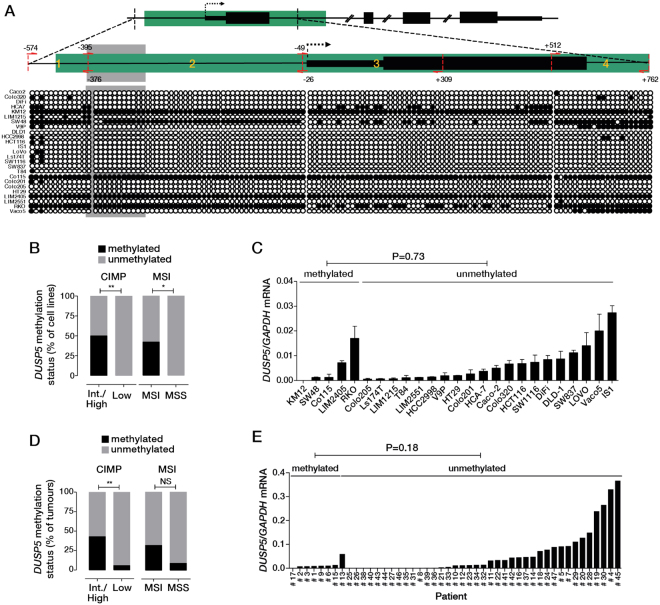
Figure 3.
DUSP5 promoter methylation in CRC cell lines and tumours. (A) Schematic of the DUSP5 gene showing the location of the CpG island (highlighted in green). The transcription start site is indicated by dotted arrow. Zoomed image shows the location of the 4 amplicons investigated for methylation change by bisulphite sequencing. Bottom panel shows the methylation status of specific CpGs (circles) within each amplicon in a panel of 25 CRC cell lines. Open circles indicate non-methylated and closed circles indicate methylated CpGs. KRAS/BRAF wild-type cell lines are shown at the top of the panel (Caco2-V9P), KRAS mutant lines in the middle DLD1-T84) and BRAF mutant lines at the bottom (Co115-Vaco5). (B) Classification of the DUSP5 promoter methylation status of the 25 CRC cell lines relative to CIMP and MSI status. (C) DUSP5 mRNA expression in the 25 CRC cell lines determined by qPCR. (D) Classification of the DUSP5 promoter methylation status of 47 CRC’s according to CIMP and MSI status. (E) DUSP5 mRNA expression in the 47 human CRC’s separated according to DUSP5 promoter methylation status. *P < 0.05, **P < 0.005.

