Fig. 6.
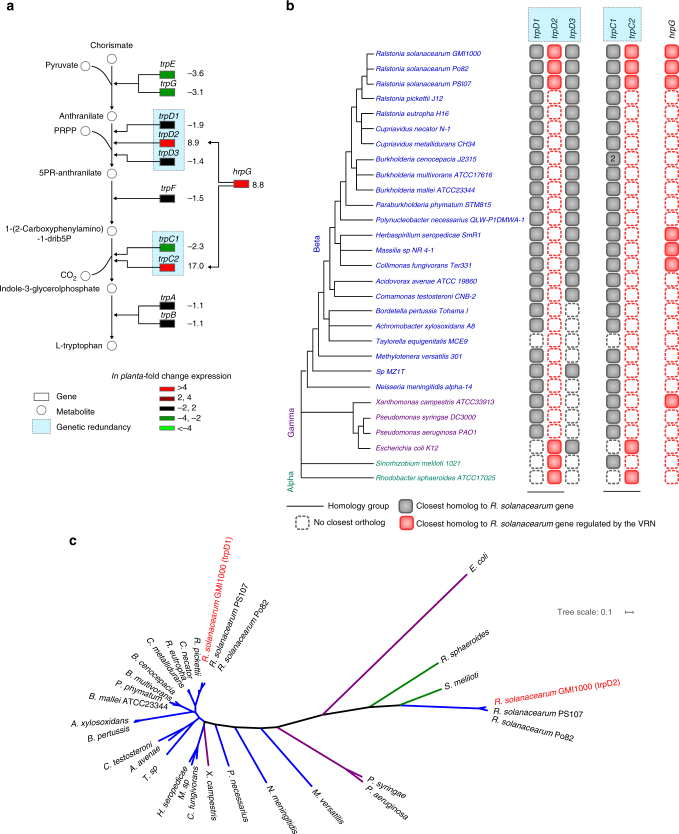
Orthology analysis of VRN-regulated and VRN-independent genes contributing to robustness within the tryptophan biosynthesis pathways. a The R. solanacearum tryptophan biosynthesis pathway and the corresponding in planta gene expression profiles. The values correspond to the absolute fold change expression levels (from Jacobs et al. 50). b Presence of homologs of the R. solanacearum genes in the various taxa is displayed by boxes. Number in the boxes corresponds to the number of paralogs present in the organism. Closest homologs to a VRN-regulated gene are colored in red, whereas the closest homologs of a VRN-independent one are in gray. In the case of two genes belonging to the same homology group, the closest homolog to a R. solanacearum gene was defined as the gene showing the highest blast score to a R. solanacearum gene. c Phylogeny analysis of the trpD1 and trpD2 homolog groups. Tree scale corresponds to 0.1 mutation

