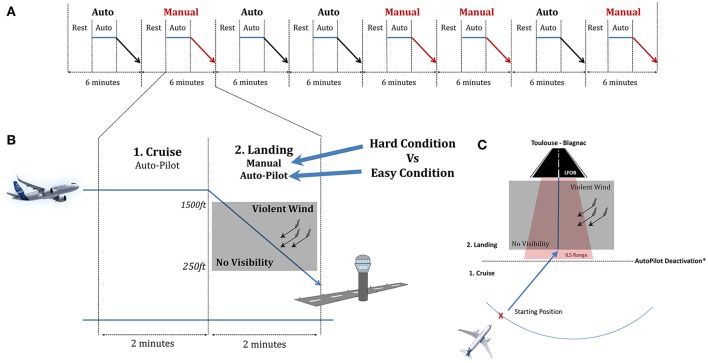
Figure 2.
Structure of the experimental session. (A) Overall Flow of the experiment with the 8 scenarios. (B) Detailed trial for the cruise and landing phases. (C) Upper view of the plane trajectory. The starting position was pseudo randomly placed on the blue arc. The blackline delimited the cruise from the landing phase where the pilot deactivate or not the autopilot regarding the condition.

