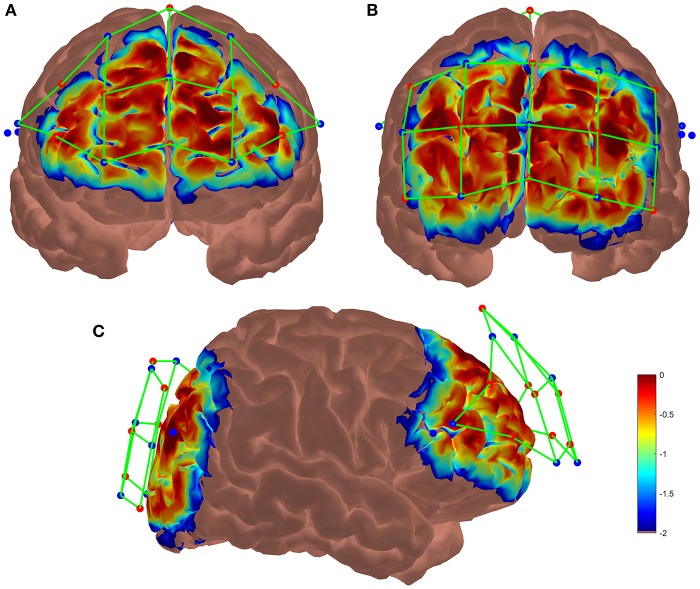
Figure 3.
Results of the Monte-Carlo simulation over (A) the frontal cortex, (B) the occipital cortex and (C) both cortices from a lateral view. Red dots represent the LED emitters, blue dots the photoreceptors and green lines the channels. The colorbar unit represents the spatial sensitivity of the fNIRS measurements. It is expressed in mm−1 and values range from 0.01 to 1 in log10 units: −2 to 0.

