Figure 1.

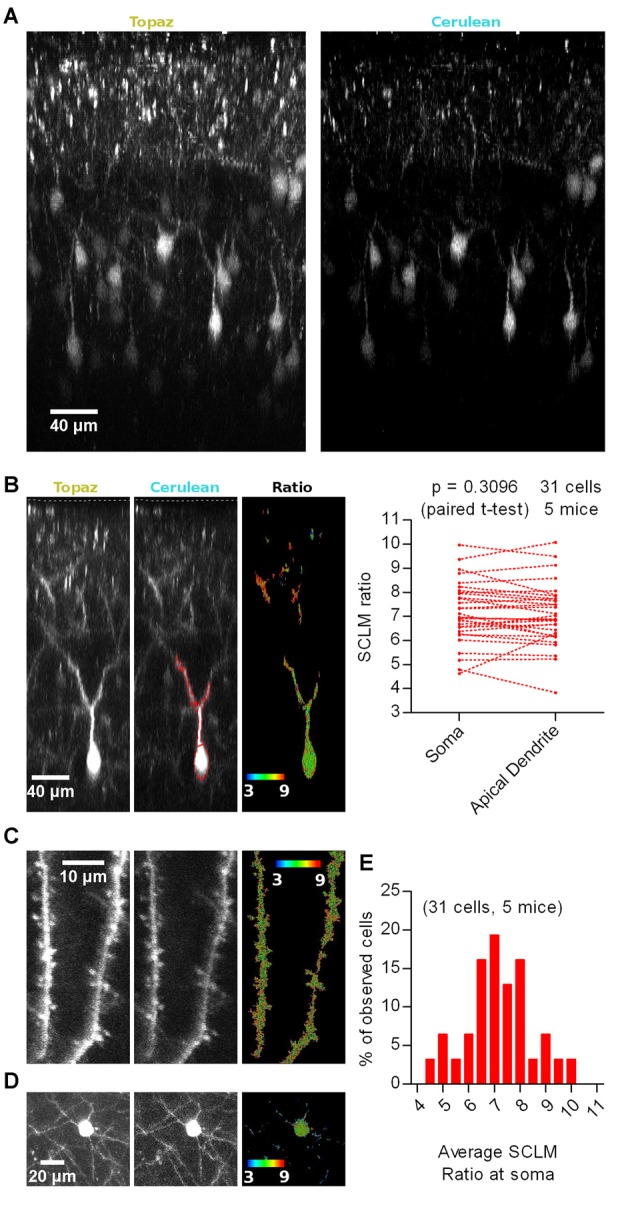
In vivo imaging of Superclomeleon (SCLM)-expressing neurons in anesthetized mice. (A) Representative maximal intensity projections of a vertically resliced data stack showing the SCLM Topaz and Cerulean signal of sparsely labeled L2/3 neurons of M1 cortex in an anesthetized mouse. Gray values were clipped to include >90% of the total fluorescence signal: Topaz, 355–7996; Cerulean, 247–1390 (B) Left: representative maximal intensity projections of a vertically resliced data stack showing the in vivo SCLM Topaz and Cerulean signals and their corresponding ratio of a L2/3 pyramidal neuron from M1 cortex in an anesthetized mouse. For display, gray values were clipped to include >90% of the total fluorescence signal: Topaz, 291–4536; Cerulean, 111–757. The displayed neuron’s soma centroid is ~270 μm deep from the surface of the brain (included in the acquired stacks and marked with a white segmented line on the Topaz and Cerulean panels). Representative somatic and dendritic regions of interest (ROIs) enclosing areas with 2 fold signal to background emission intensities are displayed with red lines on the Cerulean panel. Right: pairwise comparison of the average SCLM 540 nm/480 nm emission ratio from ROIs spanning the basal apical dendrite and soma of L2/3 pyramidal neurons from M1 cortex in the anesthetized state. (C) Representative maximal intensity projections showing SCLM Topaz and Cerulean signals and their corresponding ratio of superficial spiny dendrites of L2/3 pyramidal neurons from M1 cortex in an anesthetized mouse. Gray values were clipped to include >90% of the total fluorescence signal: Topaz, 306–3655; Cerulean, 103–774. (D) Representative maximal intensity projections showing the in vivo SCLM Topaz and Cerulean signals and their corresponding ratio of the soma and basal dendrites of L2/3 pyramidal neurons from M1 cortex of an anesthetized mouse. Gray values were clipped to include >90% of the total fluorescence signal: Topaz, 90–2000; Cerulean, 96–295. (E) Histogram showing the frequency distribution of the recorded average SCLM 540 nm/480 nm emission ratio from ROIs spanning the somas of L2/3 pyramidal neurons from M1 cortex in the anesthetized state.
