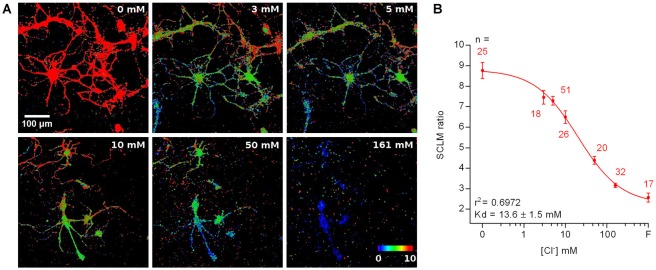
Figure 4.
Calibration of SCLM. (A) Representative images showing the in vitro SCLM ratio of hippocampal cultures in the presence of ionophores at different [Cl−] and a fixed pH of 7.1. To avoid deterioration of the cultures due to ionophore treatment, a maximum of four consecutive solutions were applied per coverslip. (B) Calibration curve constructed from ratiometric imaging of SCLM-expressing hippocampal cultures in the presence of ionophores at a fixed pH of 7.1. Mean and SEM values are plotted. F = 153 mM fluoride solution.

