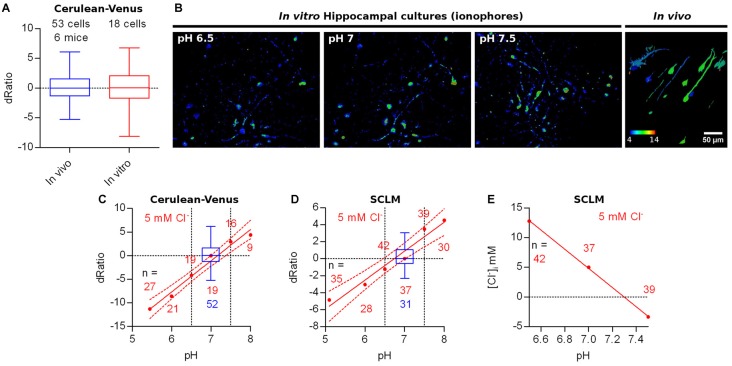
Figure 5.
Other factors affecting ratiometric emission measurements. (A) Ratio difference from the population mean ratio at pH 7–7.1 (signed deviation, dRatio) evaluated for Cerulean-Venus expressing L2/3 pyramidal neurons from M1 cortex (in vivo) or hippocampal cultures (in vitro, ACSF). (B) Representative images showing the in vitro Cerulean-Venus ratio of hippocampal cultures in the presence of ionophores at different pH and a fixed [Cl−] of 5 mM (first 3 panels) and the in vivo Cerulean-Venus ratio variability (fourth panel). (C) Red: Cerulean-Venus dRatio evaluated from hippocampal cultures in the presence of ionophores and different pH values. Mean dRatio and best fit linear regression plus 95% confidence band are plotted. Blue: dRatio distribution of Cerulean-Venus expressing L2/3 pyramidal neurons from M1 cortex in vivo. Segmented vertical lines: range of somatic pH measured in vivo. (D) As in (C) but considering SCLM. (E) Calculated [Cl−]i values from the SCLM signals obtained in the experiment shown in (D) at the in vivo pHi range (6.5–7.5) using the calibration curve from Figure 4 (constructed at pH 7.1).

