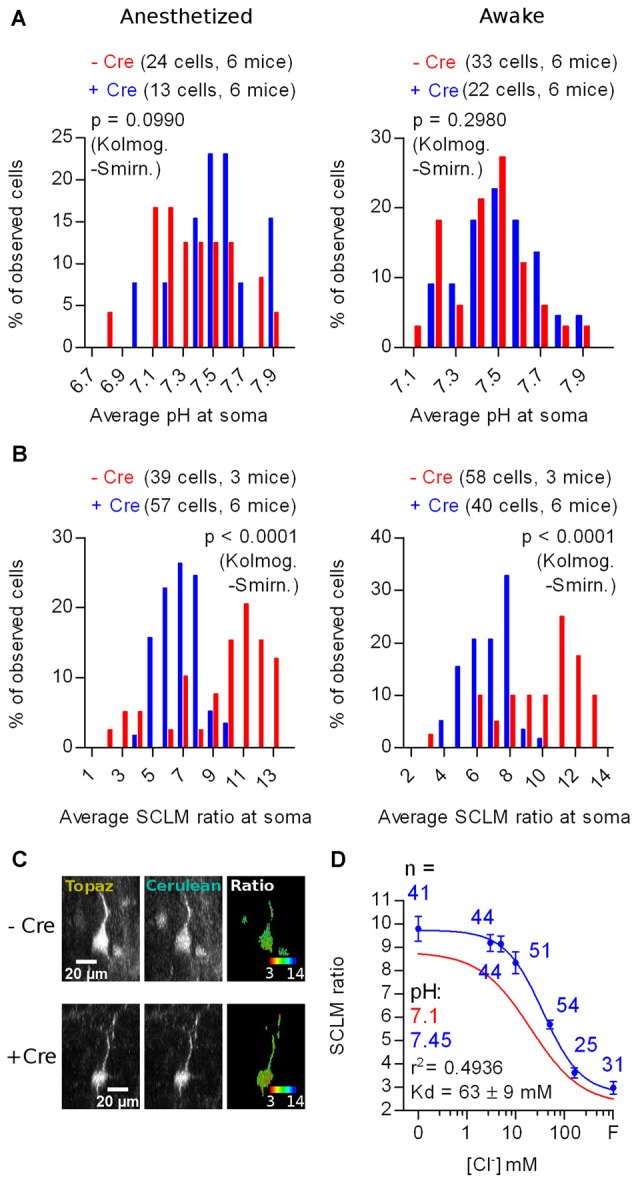
Figure 7.

In vivo effect of KCC2 deletion on the steady-state [Cl−]i of adult layer 2/3 cortex neurons. (A) Histogram showing the frequency distribution of the calculated values of pHi obtained from in vivo recordings in anesthetized and awake KCC2lox/lox mice through Cre-dependent (KO for KCC2) and Cre-independent SE-pHluorin expression. (B) Histogram showing the frequency distribution of the average SCLM 540 nm/480 nm emission ratio from ROIs spanning the somas of L2/3 pyramidal neurons from M1 cortex in KCC2lox/lox mice through Cre-dependent (KO for KCC2) and Cre-independent SCLM expression recorded in the anesthetized and awake state (left and right panels respectively). (C) Representative maximal intensity projections showing the Cre-dependent and Cre-independent SCLM signal and ratios at the soma of a L2/3 pyramidal neuron from M1 cortex of KCC2lox/lox mice in the anesthetized state. Gray values were adjusted for display as follows: Topaz − Cre, 1061–15758; Cerulean − Cre, 176–1700; Topaz + Cre, 744–13895; Cerulean + Cre, 143–1717. For easier visualization, the ratiometric look-up table is inverted with respect to the other ratiometric SCLM panels to highlight the shift towards higher [Cl−]i as a shift towards red instead of a shift towards blue in a dark background. (D) Calibration curve constructed from ratiometric imaging of SCLM-expressing hippocampal cultures in the presence of ionophores at a pH of 7.45 (blue). Mean and SEM values are plotted. The best fit calibration curve obtained at pH 7.1 is plotted in red for comparison, informed parameters correspond to the blue calibration curve.
