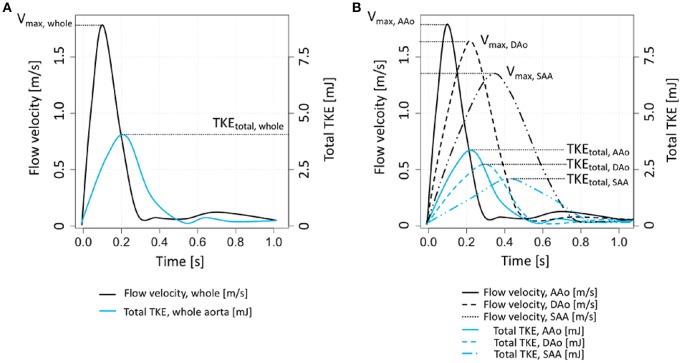
Figure 2.
Schematic description of global and regional analysis of flow velocity and TKE. (A) Global velocity and TKE analysis. A time point for Vmax, whole was chosen to analyze peak Vavg, whole and peak Vmax, whole. Peak TKEtotal, whole was separately assessed in different time frame with the velocity parameters. (B) Regional velocity and TKE analysis. Depending on the region of analysis, separate time frames for Vmax were selected to assess peak Vavg and Vmax in each aortic segment. Separate time frames for each aortic segement were also selected for estimating regional peak TKEtotal. Note that Vmax, IAA and TKEtotal, IAA were omitted from (B) for clarity.

