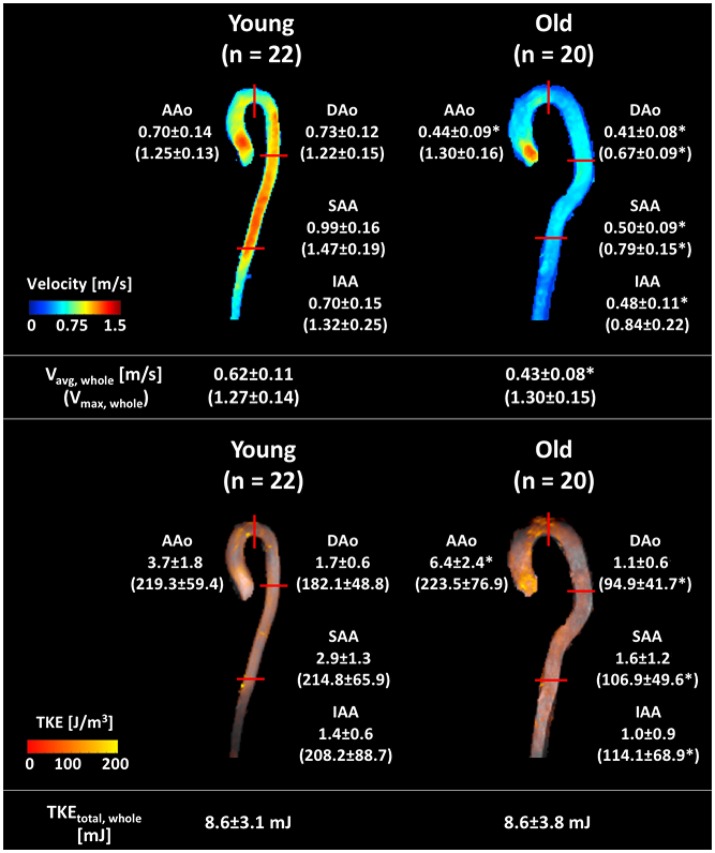
Figure 3.
Graphical summary of velocity and TKE parameters in each subject group. Velocity and TKE mapping of a representative subject of each group are shown, with the mean ± SD of the group. Upper panel shows the regional average velocity (without parentheses, m/s) and maximum velocity (within parentheses, m/s). Bottom panel shows the regional peak total TKE (without parentheses, mJ) and the regional peak maximum TKE (within parentheses, J/m3). Data are analyzed as described in Figure 2. Red solid lines indicate the region boundaries. *Indicates significant difference with p < 0.001 compared to the young group.

