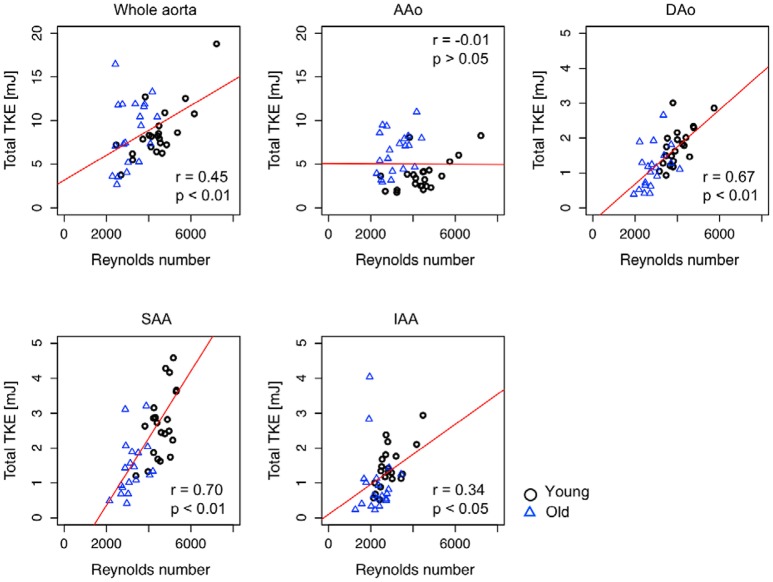
Figure 4.
Scatter plot of the relationship between regional peak total TKE and maximum Reynolds number. Pearson correlation coefficient, r, between the regional peak total TKE and the maximum Reynolds number were calculated for each region. Red solid line indicates the regression line. r and p in each plot indicate the Pearson product-moment correlation coefficient and statistical significance. Note that the peak total TKE in the whole aorta (TKEtotal, whole) was plotted against the Reynolds number in the ascending aorta (Remax, AAo) as the Reynolds number is highest in the ascending aorta (as shown in Table 2).

