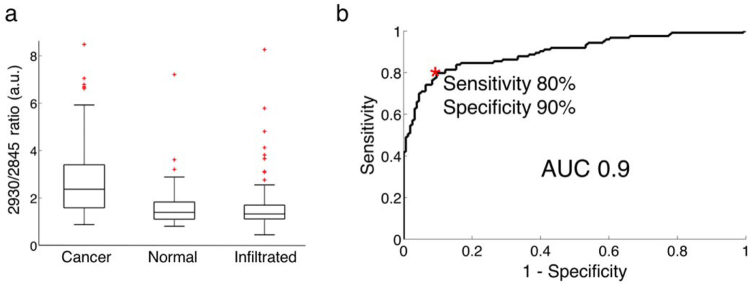
Figure 4.
(a) Boxplots of the ratio of the lipid and protein bands (2930 cm−1/2845 cm−1) for normal brain, infiltrated brain and dense cancer tissue in glioma patients. (b) Receiver operating characteristic (ROC) curve computed using the SVM algorithm and leave-one-out cross-validation. The indicated point at the minimal distance from the upper-left corner of the ROC curve was chosen for calculating the sensitivity and specificity values.

