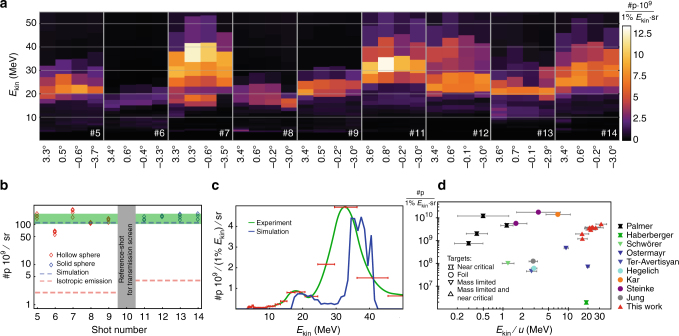
Fig. 2.
Experimental results. a Differential proton spectra for consecutive laser shots for various angles. b Proton number per solid angle from experiment compared to isotropic emission into 4π and numerical simulation, the green area represents the standard deviation of the experimental data. c Comparison of simulated differential proton spectrum and experiment (shot 11@0.8°), the red error bars indicate the spectrometer resolution. d Summary of differential ion yields for experiments reporting on narrow energy spread, represented by the horizontal error bars (FWHM). Cross-shaped symbols represent results obtained with CO2-laser pulses in gaseous plasmas with critical density, circles represent results from thin foils, and triangles pointing down spherical solid targets (such as droplets). See Refs. 6–14

