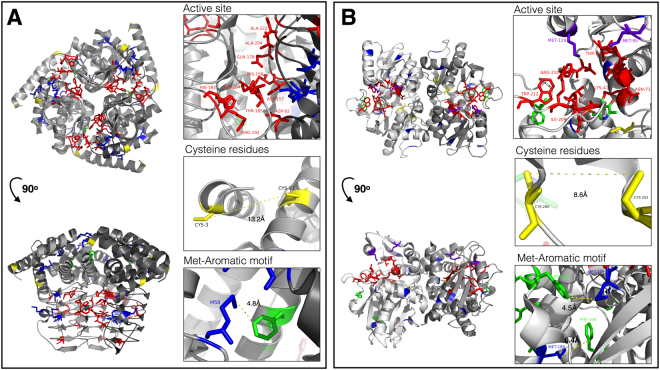
Figure 3.
Key residues highlighted on the crystal structure model of CysE and CysM proteins. Cartoon diagram of the trimer (A) E. coli serine acetyltransferase protein (CysE, PDB ID: 1T3D) and dimer (B) E. coli O-acetylserine sulfhydrylase (CysM, PDB ID: 2BHS) are shown in gray scheme with each monomer in different exposure. The active site residues (red), substituted cysteine (yellow) and methionine (blue or purple) residues are highlighted in the left diagram. Methionines displayed in purple participate as an active site residue while methionines in blue are not part of the active site. Panels on the right represent the active center (top), the two closest cysteines (middle), and an example of methionine-aromatic motifs (bottom) found within the protein structures of CysE and CysM. Distances between each amino acid residue are denoted in angstroms.

