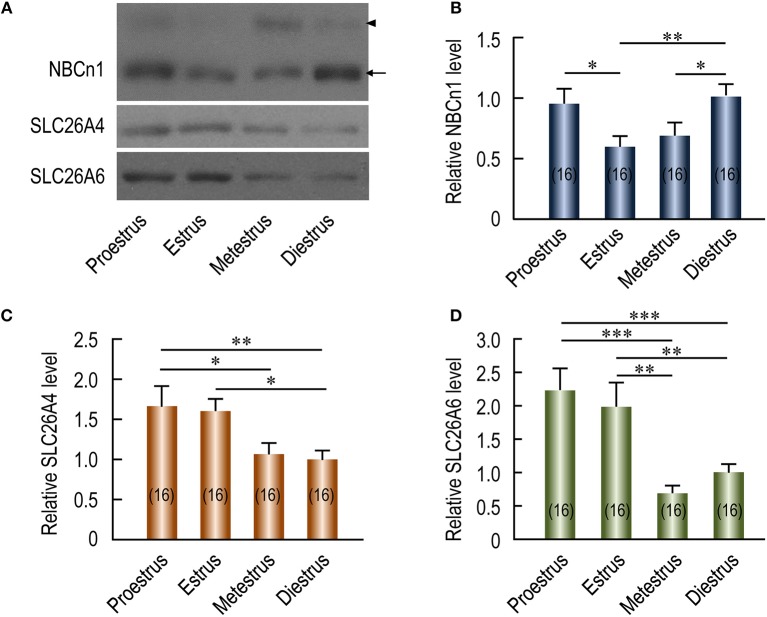
Figure 3.
Effect of estrous stages on expression of NBCn1, SLC26A4, and SLC26A6 in mouse uteri. (A) Representative western blotting of NBCn1, SLC26A4, and SLC26A6 in mouse uteri at different estrous stages. (B,D) Summary showing the relative abundance of uterine NBCn1 (B), SLC26A4 (C), and SLC26A6 (D) in mouse uteri at different estrous stages. In A, each lane represents the uterus from a single mouse. Equal amount (10 μg) of total membrane proteins were loaded into each lane on the same gel for western blotting analysis. Equal loading was verified by Coomassie staining (see details in Supplementary Figures S4D–F). Full-length blots for the images in A are shown in Supplementary Figures S4A–C. To create the bar graphs, raw densitometric density was obtained for the target band in each lane on a specific blot by using ImageJ. The density of the “diestrus” lanes on this blot was averaged. The raw densitometric density of each individual lane was then divided by this average density of the “diestrus” lanes to create a normalized value, representing the relative protein abundance of the transporter in the membrane preparation. Such normalized values from different blots were pooled to create the bars in B–D. The data were presented as mean ± SEM. The figures in the parenthesis of each bar represent the number of the mice included in the corresponding group, each mouse analyzed individually. One-way ANOVA followed by Fisher's post-hoc multiple comparisons was performed for statistical analysis. *p < 0.05; **p < 0.01; ***p < 0.001.

