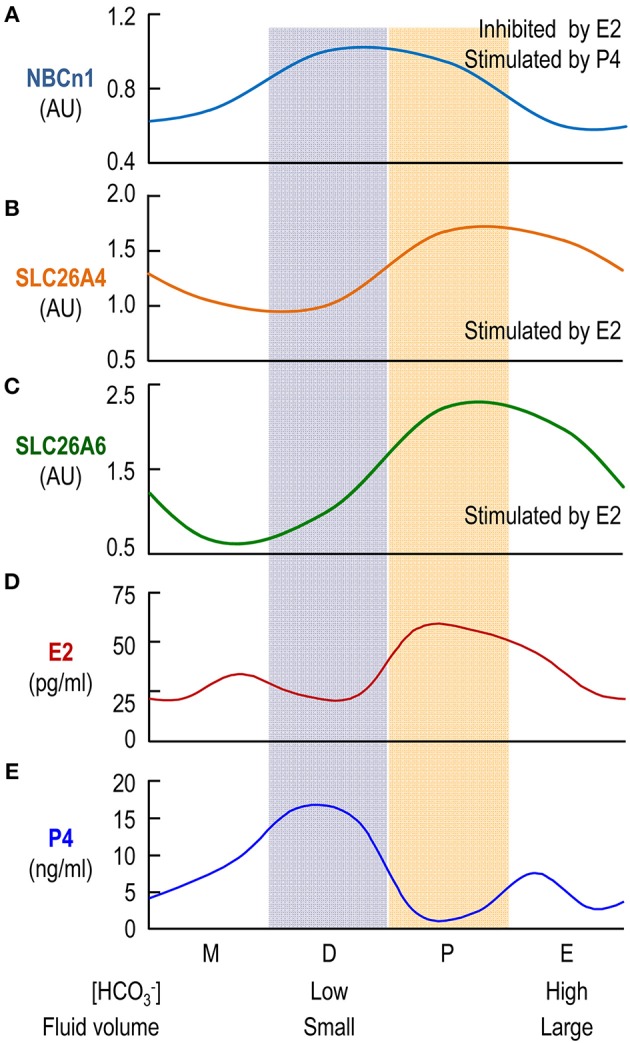
Figure 7.

Comparison of profiles of protein abundances of uterine transporters and plasma levels of β-estradiol and progesterone. The profiles for the relative protein levels of NBCn1 (A), SLC26A4 (B), SLC26A6 (C) are fitted based upon the data shown in Figure 3. The profiles of the blood plasma β-estradiol (E2; D) and progesterone (P4; E) are plotted based upon the previously reported data (Walmer et al., 1992).
