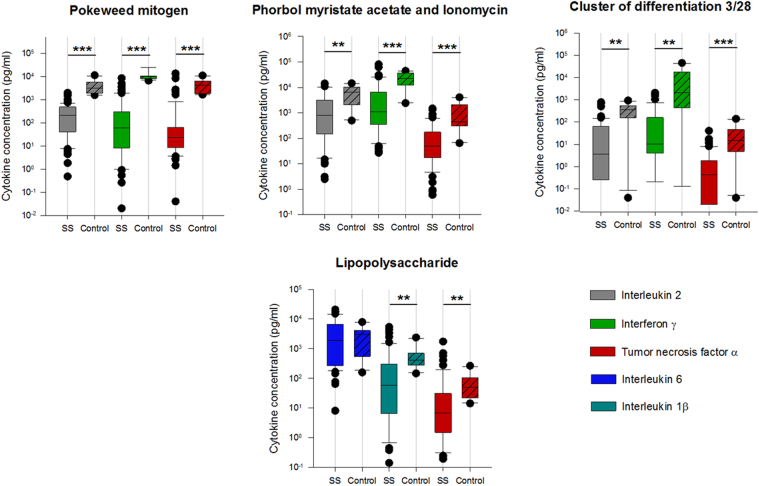
Figure 2.
Patients versus control group after stimulation with PWM, PMA, CD3/28 and LPS. PWM: Pokeweed mitogen, LPS: Lipopolysaccharide, PMA-I: Phorbol myristate acetate and Ionomycin, CD3/28: Cluster of Differentiation 3/28, SS: severe sepsis/septic shock patients. Blood samples were taken subsequently to study enrolment (SS) or at a time of subjective physical well-being (control group), respectively. In boxplots, boxes show the median and interquartile range (IQR), whiskers represent the 10th and 90th percentile. Statistically significant differences (Mann-Whitney Rank Sum Test) are indicated as follows: *p < 0.05, **p < 0.01, ***p < 0.001. Y-axis: logarithmic scale.

