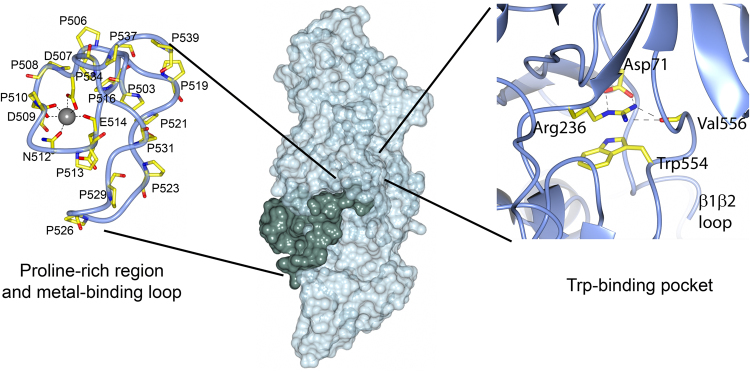
Figure 3.
Surface representation of Mfa1. Mfa1 in surface representation in light green. The proline-rich region is illustrated in dark green. The left insert shows the proline-rich region coordinating the metal ion. The right insert shows Trp554 and the hydrogen bonds between Asp71(OD1 and OD2) and Arg236 (NE and NH2) and between Val556(O) and Arg236(NH1 and NH2). Prolines, metal coordinating residues and residues in the tryptophan pockets are labelled.

