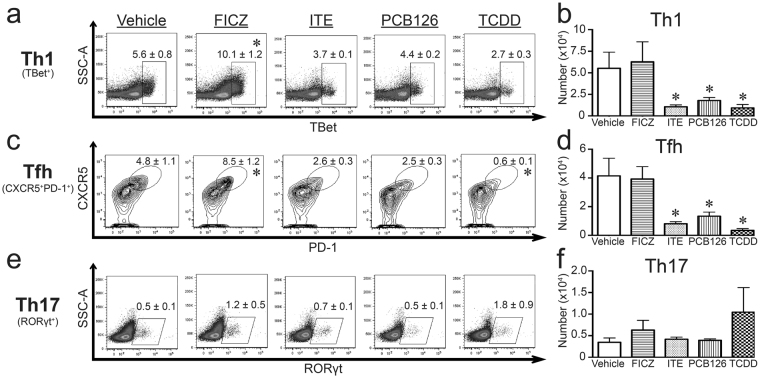
Figure 3.
AHR ligand treatment alters conventional CD4+ T cell responses during infection in a ligand-specific manner. Mice were exposed and infected as described in Fig. 1. MLNs were harvested 9 days after infection, and cells were stained for flow cytometry. (a,c,e) Representative plots with mean percentage (± SEM) of CD4+ T cells that are (a) Th1 cells (TBet+CD4+, gated on CD4+ cells), (c) Tfh cells (CD44hiCXCR5+PD-1+CD4+, gated on CD44hiCD4+ cells), and (e) Th17 cells (RORγt+CD4+; gated on CD4+ cells). (b,d,f) The graphs show number (± SEM) of (b) Th1 cells, (d) Tfh cells, and (f) Th17 cells. 5–8 mice were used per group, and an * indicates a p value ≤ 0.05 compared to vehicle control. All experiments have been independently repeated at least once and yielded similar results.

