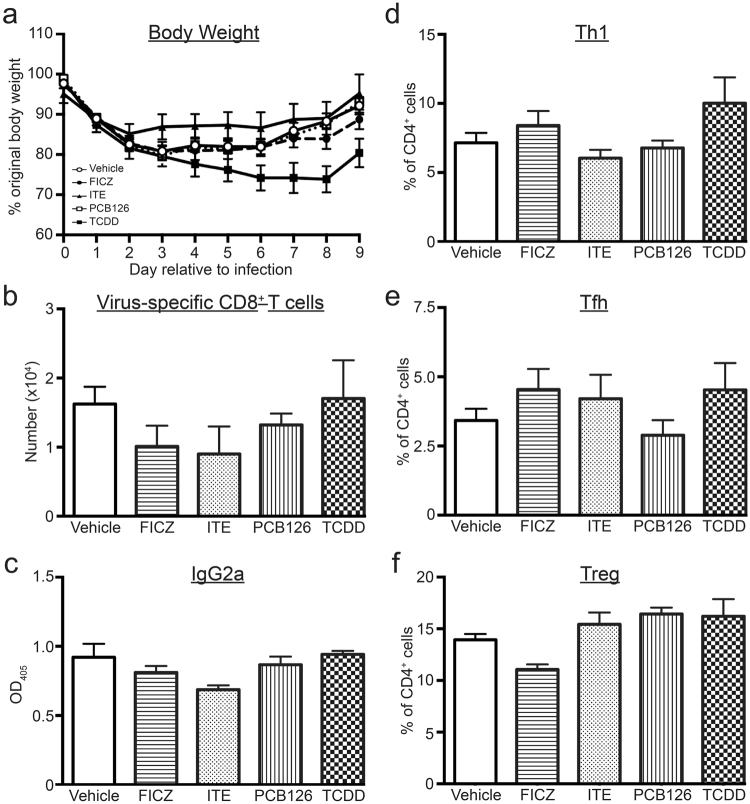
Figure 6.
AHR mediates the effects of all four ligands on T cell and antibody responses to infection. Age-matched and sex-matched Ahr−/− mice were treated with AHR ligands and infected with IAV, as in Fig. 1. MLN and serum were harvested on day 9 post infection, and MLN cells were stained for flow cytometry. T cell subsets were defined as in Figs 2–4, and virus-specific IgG levels were measured by ELISA. Graphs depict the (a) the percent body weight change relative to the day prior to infection for mice in all treatment groups, (b) number of virus-specific (DbNP366–374+) CD8+ T cells, (c) the relative amount of circulating anti-influenza IgG2a, (d) the percentage of TBet+CD4+ (Th1) cells, (e) the percentage of CD44hiCXCR5+PD-1+ CD4+ (Tfh) cells, and (f) percentage of Tregs (Foxp3+CD25+CD4+). 5–8 mice were used per treatment group. All data are shown ± SEM.

