Figure 3.
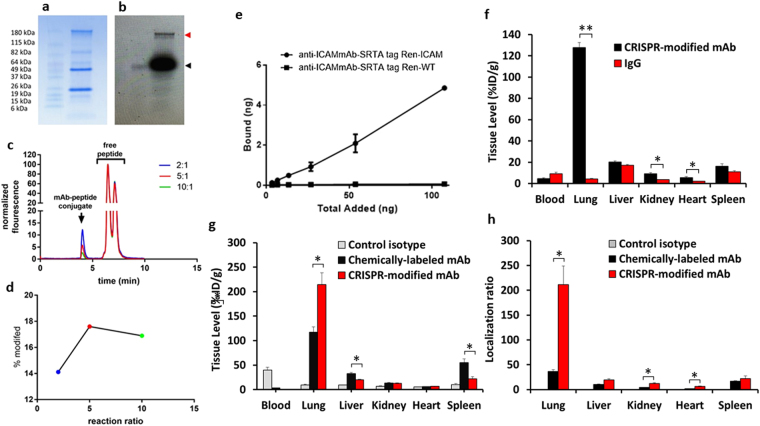
Conjugation efficiency and biodistribution analysis of CRISPR-modified antibody. (a) Coomassie blue stained gel of sortase-mediated conjugation of modified antibody to GGG-fluorophore. (b) Fluorescence scan of the antibody-fluorophore, stained with anti-Flag-HRP, showing the antibody conjugated fluorophore (red tab) compared to free fluorophore (black tab). (c) HPLC fluorescence trace antibody-fluorophore conjugates at different molar ratios. (d) Quantitative analysis of the percent of antibody modification. (e) Binding of 125I-labeled CRISPR-modified antibody to REN-ICAM and REN-WT cells. (f) Biodistribution of 125I-labeled CRISPR-modified anti-ICAM mAb in mice at 30 min. Tissue uptake is indicated as mean ± SEM (n = 3). Biodistribution analysis was performed comparing 111In-labeled site-specific CRISPR/Cas9- to chemically-modified mAb. (g) Biodistribution of 111In-labeled anti-ICAM mAb modified in mice at 30 min. Tissue uptake is indicated as mean ± SEM. (h) Localization ratio of selected organs. Significant differences were determined by t-test with Bonferroni correction to account for multiple comparisons.

