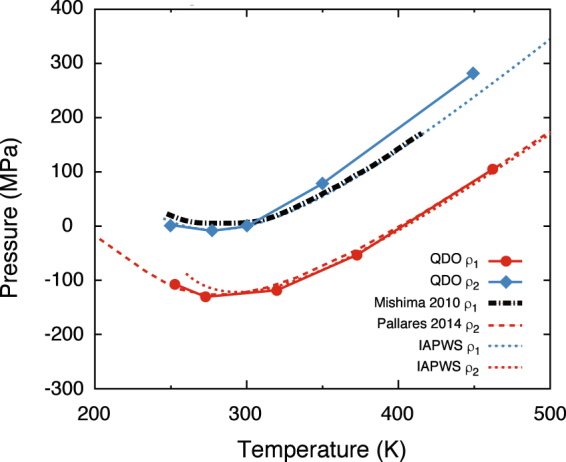
Figure 1.

The pressure of 300 QDO-water molecules as a function of temperature at two constant volumes: ρ1 = 51.8002 mol/l (red) and ρ2 = 55.3173 mol/l (blue). The dashed line represent equivalent data digitized from Pallares et al.32 (ρ1, experimental estimates via simulations of TIP4P/2005). The dotted lines represent the corresponding isotherms of the IAPWS-95 reference equation of state for water30. The black dot-dashed line corresponds to an interpolated isochore based on the experimental data measured by Mishima31.
