
Figure 1.
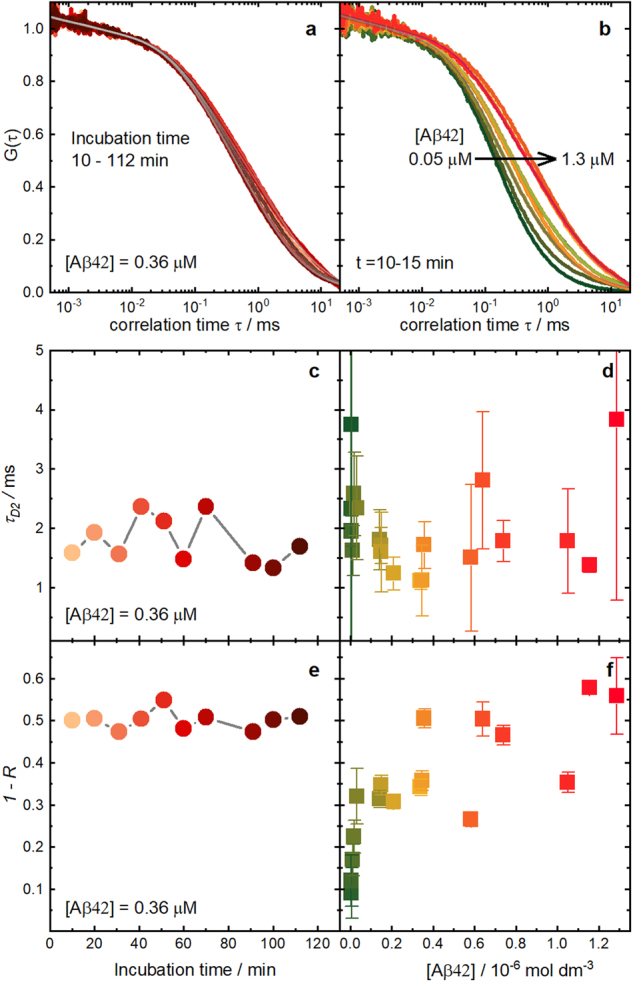
Dependence of Aβ42 amyloid aggregation on incubation time and Aβ42 concentration. Examples of FCS measurements of samples with labelled Aβ42, Aβ*, mixed with different concentrations of unlabelled Aβ42, Aβ°: (a) experimental and fitted correlation curves at different incubation times for a fixed total amyloid concentration in solution of 0.36 μM; (b) experimental and fitted FCS curves for different Aβ42 concentrations at the same short incubation time of 10–15 min; (c) diffusion times of the aggregates (τD2) determined from the FCS curves of panel a against incubation time; (d) mean diffusion times of the aggregates (τD2) obtained from the FCS curves measured at different incubation times for each sample against total Aβ42 concentration; (e) contribution of the aggregates (1-R) to the diffusion term for the FCS curves of panel a against incubation time; (f) mean contribution of the aggregates (1-R) obtained from the FCS curves measured at different incubation times for each sample against total Aβ42 concentration. The error bars in panels d and f indicate the standard deviation of the values measured for each sample at different incubation times. The Aβ42 concentration refers to the experimentally determined real concentrations in solution.