Figure 6.
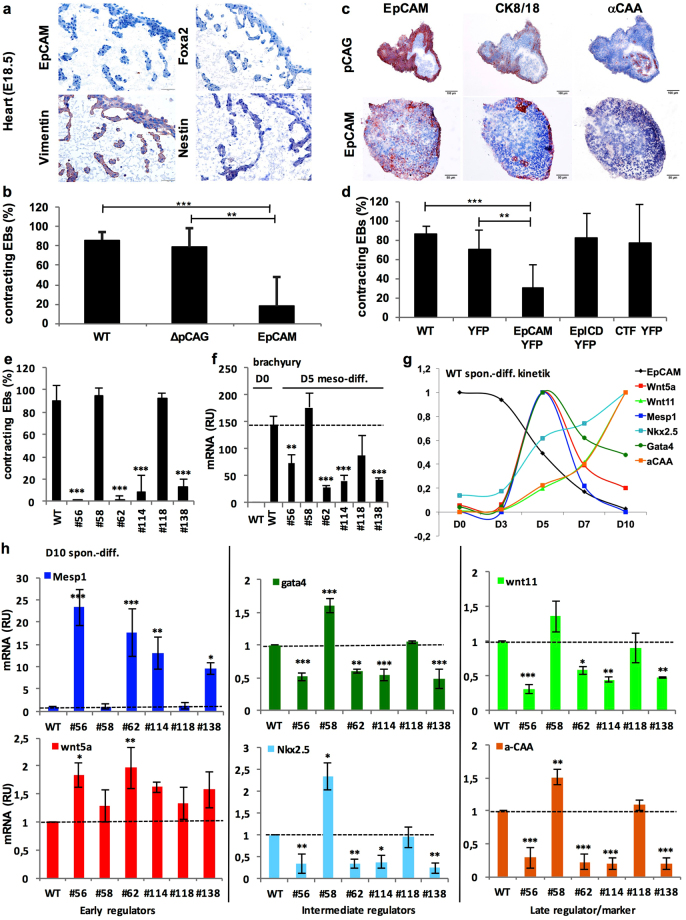
EpCAM expression regulates cardiomyocyte formation. (a) EpCAM, Foxa2, vimentin and nestin expression was assessed by immunohistochemistry staining in E18.5 heart of C57BL-6 mice. (b) Shown are percent of contracting EB of wild-type E14TG2α ESC (WT), pCAG and EpCAM transfectants at day 10 of spontaneous differentiation (n ≥ 4 independent experiments). (c) EpCAM, CK8/CK18 and α-CAA expression was assessed by immunohistochemistry staining in consecutive sections of contracting EB from pCAG and non-contracting EB from EpCAM-expressing E14TG2 ESC (D10). (Representative pictures of n = 3 independent experiments). Scale bars represent 100 µm (upper panels) and 50 µm (lower panels). (d) Percent contracting EB of wild-type E14TG2α ESC (WT), YFP, EpCAM-YFP, EpICD-YFP and CTF-YFP expressing transfectants at day 10 of spontaneous differentiation (n ≥ 4 independent experiments). (e) Shown are percent contracting EB of wild-type E14TG2α ESC (WT) and EPCAM knockout clones at day 10 of spontaneous differentiation (n ≥ 4 independent experiments). (f) Brachyury mRNA expression in wild-type and EpCAM knockout E14TG2α ESC clones was measured by quantitative PCR after mesodermal differentiation upon treatment with CHIR 99021 and cyclopamine at day 5 (n = 3 independent experiments). (g) Wnt5a, Mesp1, Wnt11, Gata4, Nkx2.5 and α-CAA mRNA expression was measured by quantitative PCR in wild-type E14TG2α ESC after spontaneous differentiation in a kinetic at the indicated time points (n = 3 independent experiments). (h) Wnt5a, Mesp1, Wnt11, Gata4, Nkx2.5 and α-CAA mRNA expression measured by quantitative PCR in wild-type and EpCAM knockout E14TG2α ESC clones after spontaneous differentiation (D10) (n = 3 independent experiments). Markers in (g–h) are all color-coded. Mean ± SEM; Student’s T-test (n = 2 groups) or One-Way ANOVA (n ≥ 3 groups); p < 0.05, **p < 0.01, ***p < 0.001.

