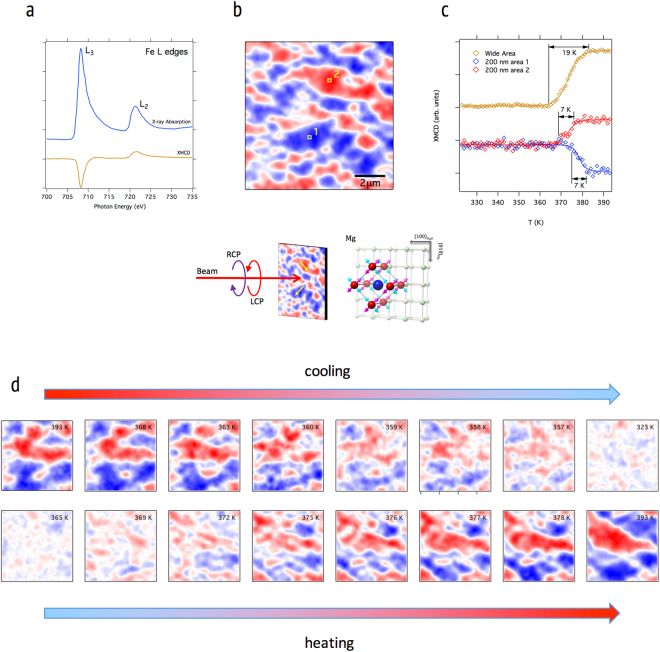
Figure 3.
Temperature dependent X-PEEM data showing the magnetic domain evolution during the phase transition. By tuning the incident photon energy to an appropriate resonance, the strong XMCD effect is exploited, as in (a), to obtain magnetic domain images from the difference of LCP and RCP images (b). Data in (a) and (b) were taken at 410 K. In (c), we show the magnetization during the heating transition for the local domain magnetization (red and blue) and the average magnetic ordering over a wide area. The local magnetization plots are derived from the pixel sums of two 200 × 200 nm ROIs as shown by the yellow squares in (b). The wide-area plot is derived from the standard deviation of the pixel sum over the entire image in (b), giving a measure of the magnitude of the domain magnetizations along the beam direction independent of their signs. Open symbols in (c) are experimental data, and the corresponding lines are Brillouin fits. We note that the single domain transitions are narrower than the average, and have varying initial nucleation and transition midpoint temperatures. The transition midpoint temperature, T0, for areas 1 and 2 are 378.5 and 373.2 K, respectively, while for the average transition T0 = 373.4 K. This supports a model of the transition in which defects lower the transition temperature via local strain, resulting in a distribution of transition temperatures that broadens the overall transition. In (d), we show a detail of the domain nucleation and growth through a complete cooling (upper) and heating (lower) cycle in 4 × 4 μm temperature dependent X-PEEM images.

