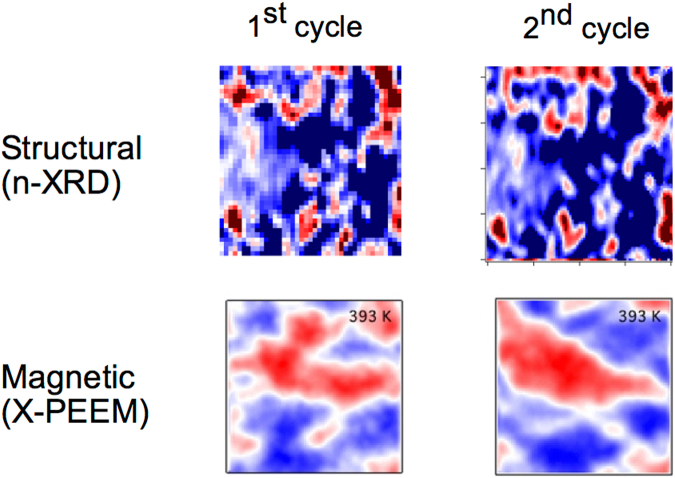
Figure 4.
Nano-XRD images taken at the midpoint of the structural transition (upper) and X-PEEM images taken in the high temperature phase (lower) for two consecutive heating and cooling cycles. Note that the structural and magnetic images show two different contrast mechanisms. The structural data show the formation of high temperature phase islands in a matrix of low-temperature phase, while the magnetic data indicated domains of opposite magnetization in the high-temperature phase. In the structural transition, the return point memory is nearly complete, with a close correlation between the domain configurations from cycle to cycle. The magnetic transition displays more stochasticity in the final domain states, although some return point memory does exist. All images are 4 × 4 μm.

