Figure 1.

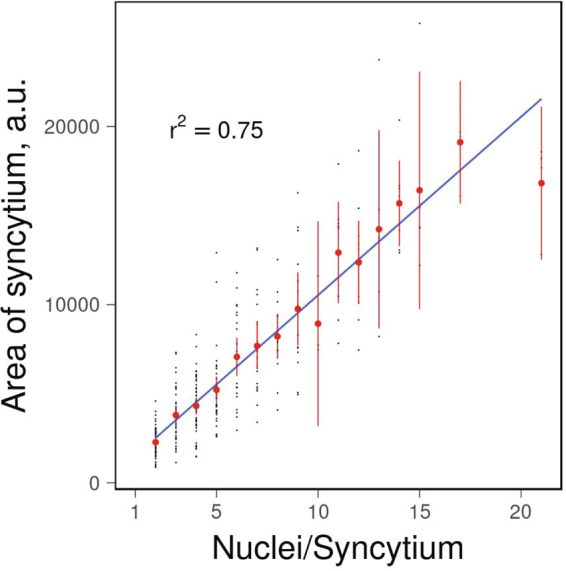
The number of nuclei in an osteoclast is proportional to its cross-sectional area. Human monocytes were induced to form osteoclasts and their cross-sectional area and number of nuclei per cell were analyzed as described in methods. Black points represent individual syncytia; red points and whiskers show mean cross-sectional area and standard error of mean for syncytia with a corresponding number of nuclei; blue line show linear fit to the data.
