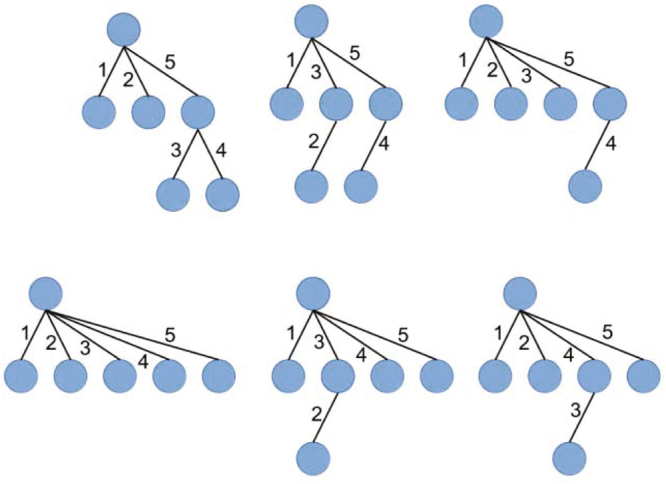
Figure 2.

Tree representations for different pathways of formation of 6-nucleated syncytia. Blue circles represent mononuclear cells and correspond to vertices of the graph, while edges correspond to cell-to-cell fusions. Numbers show a place of a given fusion event in the sequence of fusion events. For example, in a sequence on the left of the bottom row, a syncytium is growing by sequential fusions of mononucleated cell forming 2, 3, 4, 5 and finally 6 nucleated cell. On the other hand, a sequence on the left of the top row, first, we have formation of two 3-nucleated cells and then these two cells fuse together to give six-nucleated cell. In both cases, there are 5 fusion events in total.
