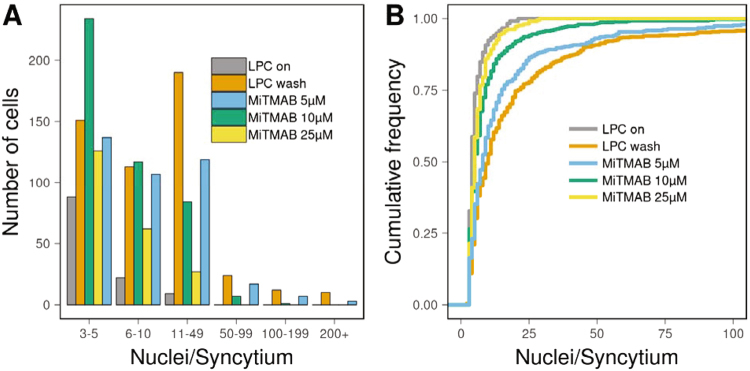
Figure 3.
Different representations of syncytia size distribution. RAW264.7 cells were committed to osteoclastogenesis by RANKL application at t = 0. LPC was applied at t = 72 h and removed at t = 88 h (LPC wash). Number of nuclei per syncytia was analyzed at t = 89.5 h (i.e., 90 min after LPC removal) as described in methods. At the time of LPC removal cells were treated with different concentrations of MiTMAB or not treated with MiTMAB (“LPC Wash”) cells. In the negative control experiment (“LPC on”), LPC was not removed. (A) Bar heights represent numbers of syncytia within ranges of nuclei per syncytia denoted on X-axis. Different experimental conditions are shown in different color. (B) Empirical CDFs of number of nuclei per syncytia are shown in different color for different experimental conditions.

