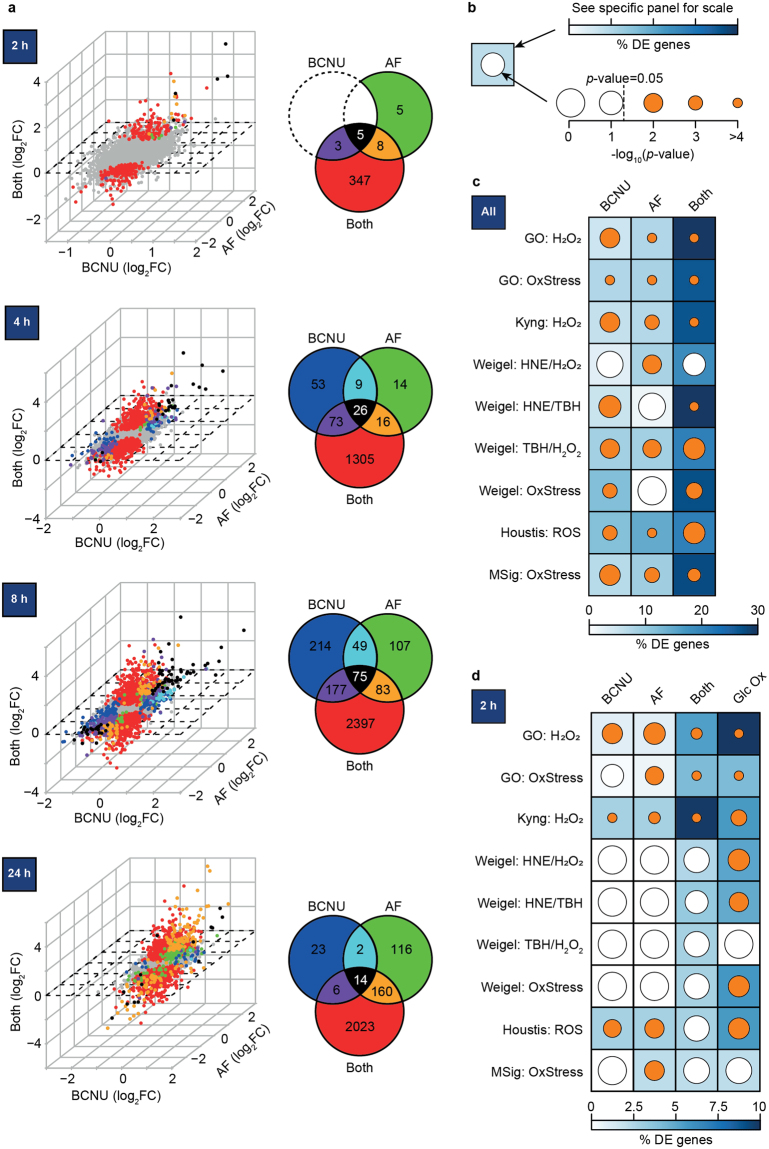
Figure 2.
The combined inhibition of thioredoxin and glutathione recycling generates an oxidative stress response in adipocytes. 3T3-L1 adipocytes were treated with 100 µM 1,3-bis-(2-chloroethyl)−1-nitrosourea (BCNU) or 1 µM auranofin (AF) for 2, 4, 8, and 24 h, after which RNA was harvested and subjected to microarray analysis. (a) Differentially-expressed genes for each timepoint. The Venn diagram shows the number of overlapping differentially-expressed genes across different drug conditions. In the scatterplots, each axis resembles a condition (BCNU, auranofin, both drugs), depicting fold-change in expression compared to control. Each dot depicts a single gene, with the same colour scheme used in the corresponding Venn diagram. Unaltered genes are depicted in grey. Details can be found in Supplementary Table S1. (b–d) Comparison of genes in common between oxidative stress gene sets (curated from public databases and literature) and the differentially-expressed genes under each drug condition from (c) any time-point or (d) only the 2 h time-point. As shown in (b), the percentage overlap (relative to the number of genes in each oxidative stress gene set) is reflected by the colour of the background square. The inner circle denotes statistical significance of the overlap by hypergeometric enrichment analysis65: smaller circles reflect lower p-values, with orange circles denoting p < 0.05. Differentially-expressed genes in 3T3-L1 adipocytes treated with glucose oxidase is included as a positive control in (d). Details of these analyses can be found in Supplementary Table S2. Abbreviations: GO, Gene Ontology; H2O2, hydrogen peroxide; HNE, 4-hydroxynonenal; TBH, tert-butylhydroperoxide; OxStress, oxidative stress; ROS, reactive oxygen species.

