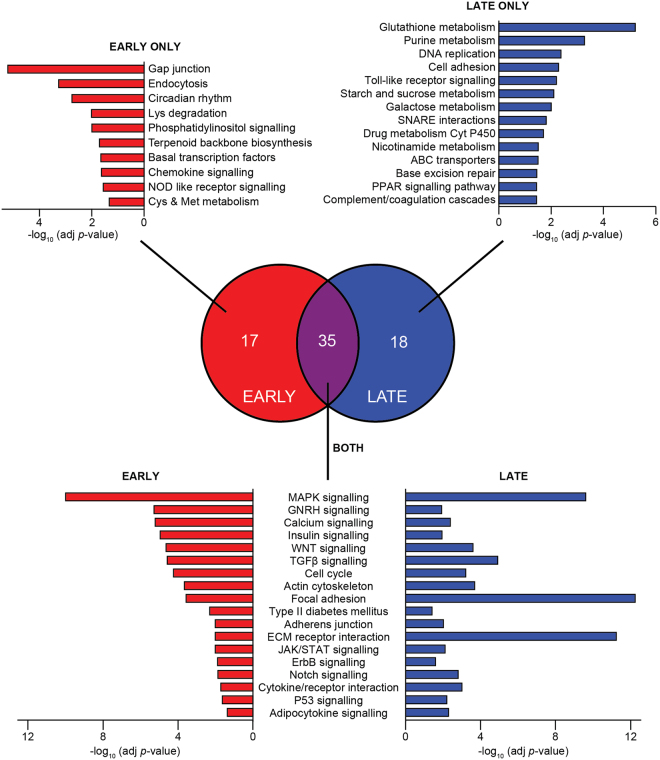
Figure 3.
The early and late response to oxidative stress differs in pathway enrichment, but both overlap with insulin resistance. Using the gene expression data from 3T3-L1 adipocytes co-treated with BCNU and auranofin (detailed in Fig. 2), pathway enrichment analysis was performed using genes differentially-expressed either early (2, 4, 8 h) or late (24 h) in the oxidative stress response. Enriched pathways are defined by FDR < 0.05 (details in the Materials and Methods). The Venn diagram depicts the overlap of all enriched pathways, with selected pathways and their adjusted (adj) p-values depicted adjacent to the Venn diagram. Enriched pathways with little relevance to adipocyte biology (cancer, neuronal function, cardiomyopathy, and microbial infection) have been omitted for clarity. The complete list of enriched pathways and their associated statistics can be found in Supplementary Table S3. Abbreviations: Cys, cysteine; Met, methionine.

