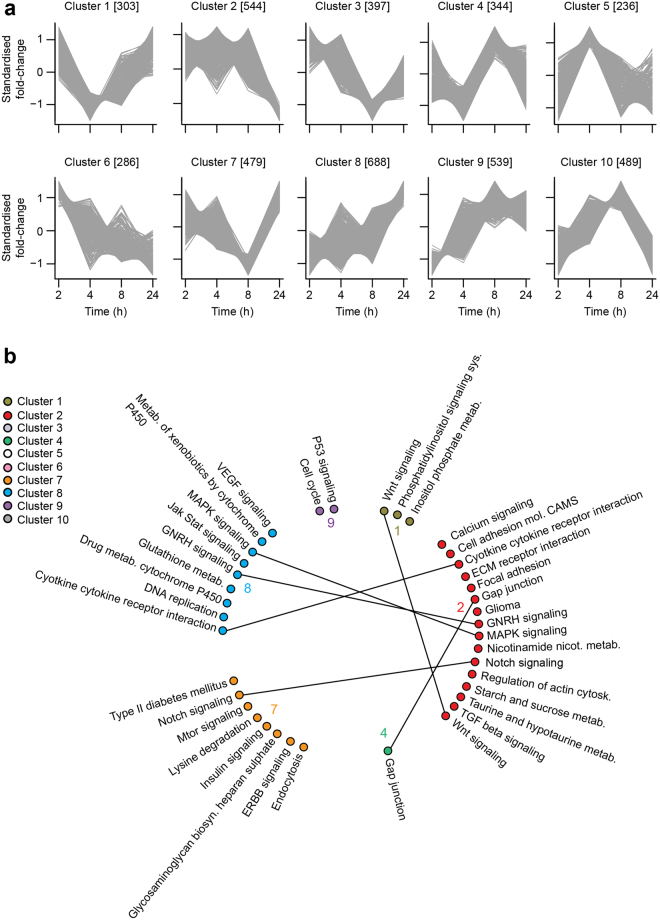
Figure 4.
Oxidative stress stimulates a range of gene expression patterns, accompanied with different temporal patterns of pathway enrichment. (a) Using the gene expression data from 3T3-L1 adipocytes co-treated with BCNU and auranofin (detailed in Fig. 2), a hierarchical clustering analysis was performed on the differentially-expressed genes using prior knowledge of TF-TG interactions, as described in the Methods and Materials. The parenthesised numbers denote the number of genes in each cluster. Members of each cluster are detailed in Supplementary Table S4. (b) Pathway enrichment analysis of each cluster. Only six out of the ten gene clusters enriched for pathways. Selected pathways are depicted, with the complete list and associated statistics found in Supplementary Table S4. Common pathways between clusters are connected by lines.

